Key Highlights:
Liquidity
During the third week of June, 2019, the weighted average call money rate has increased to 5.78%. This is 3 bps higher than the benchmark rate (repo rate). The overnight lending rate was 5.72% a week earlier. It is understood that the liquidity pressure is due to quarter end (GST filling for Q1, FY19). India’s forex reserve has also reached all time high of 426.4 billion by end of June, 2019. Increase in forex reserve will have a positive impact on the domestic liquidity. Similarly, currency in circulation (CiC) has declined by (-)0.6% during the week time. This is indicating an improvement in deposit grow in coming weeks.
Capital Market
On the global capital market, the sovereign yields are continued falling. The 10-year US G-Sec has declined almost 50 bps in last two months and reached 2% during the third week of June, 2019. On the domestic front, the 10-year Indian sovereign yield has reached 6.9% during the said period. The fall in 10-year Indian G-Sec is on account of weaker supply of debt, fall in US sovereign yield and global commodity prices.
Currency Trend
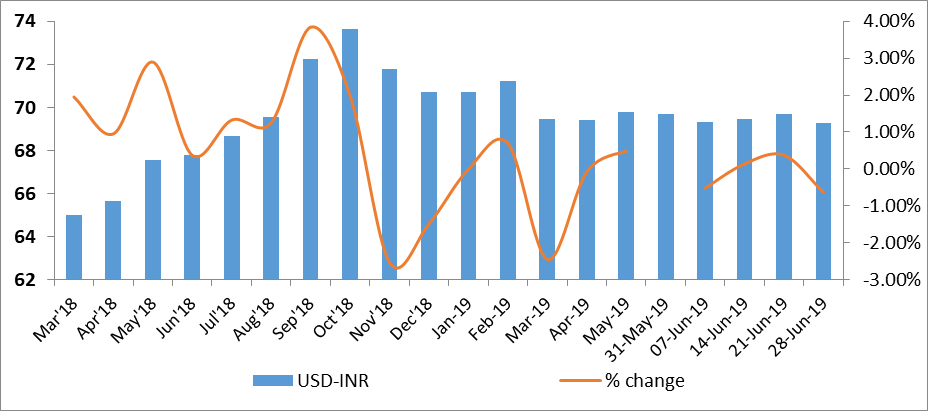
In the global currency market, the emerging market currencies’ are having mixed response to the global geo-political uncertainty in the Middle East. The currencies such as ZAR, TRY, CNY and INR have been strengthening against the US Dollar during the third week of June, 2019. Currencies such as RUB, CAD and SGD are depreciating against the USD.
Interest rates and ratio:
|
Interest Rate |
June 22 |
May 24 |
May 31 |
June 7 |
June 14 |
June 21 |
|
2018 |
2019 |
2019 |
2019 |
2019 |
2019 |
|
|
Policy Repo Rate |
6.25 |
6.00 |
6.00 |
5.75 |
5.75 |
5.75 |
|
Call Money Rate (WA) |
6.22 |
5.93 |
5.90 |
5.81 |
5.72 |
5.78 |
|
364-Day Treasury Bill Yield |
7.10 |
6.41 |
6.30 |
6.19 |
6.13 |
6.13 |
|
2-Yr Indian G-Sec |
7.51 |
6.40 |
6.27 |
6.21 |
6.22 |
6.29 |
|
10-Yr Indian G-Sec |
7.92 |
7.27 |
7.07 |
7.04 |
6.99 |
6.91 |
|
10-Yr US G-Sec |
2.86 |
2.13 |
2.08 |
2.08 |
2.06 |
2.01 |
|
AAA (Indian corporate) |
8.61 |
8.42 |
8.11 |
8.11 |
8.27 |
8.09 |
|
Spread in bps (10Yr Indian-10Yr US) |
506 |
514 |
499 |
496 |
493 |
490 |
|
Credit/Deposit Ratio |
75.88 |
76.98 |
- |
76.97 |
- |
- |
|
USD LIBOR (3 month) |
1.9279 |
2.3563 |
2.3545 |
2.346 |
2.3466 |
2.3415 |
Acuité Portfolio Debt Instrument Benchmark Estimates (as on 10 June
2019):
|
Category |
10-Yr Corporate Yield to Maturity |
|
AAA* |
NA |
|
AA+ |
8.04% |
|
AA |
8.65% |
|
|
Deposit (In Rs. Lakh cr) |
Bank Credit (In Rs. Lakh cr) |
|
As on June 07, 2019 |
125.40 |
96.52 |
|
As on May 10,2019 |
125.17 |
96.26 |
|
As on June 08,2018 |
114.08 |
85.94 |
|
YTD (% change) |
0.18% |
0.27% |
|
YoY (% change) |
9.92% |
12.31% |
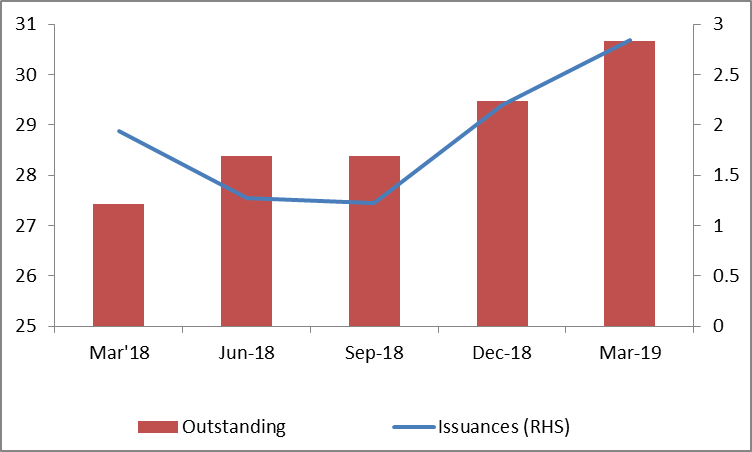
Money Market
Performance
|
Commercial Paper (Fortnight): |
Outstanding (In Rs. Lakh cr) |
Amount issued (In Rs. Lakh cr) |
|
31-Mar-2019 |
4,830.8 |
1013.0 |
|
28-Feb-2019 |
5,208.1 |
900.8 |
|
31-Mar-2018 |
3,725.8 |
999.2 |
|
% Change (MoM) |
-7.24% |
12.45% |
|
% Change (YoY) |
29.66% |
1.38% |
Indices
|
|
29-Jun-18 |
07-Jun-19 |
14-Jun-19 |
21-Jun-19 |
28-Jun-19 |
|
NSE Index |
10,714.30 |
11,870.65 |
11,823.00 |
11,724.10 |
11,788.85 |
|
NSE Index Return |
-0.99 |
-0.44 |
-0.4 |
-0.84 |
0.55 |
|
BSE Index |
35,423.48 |
39,615.90 |
39,452.07 |
39,194.49 |
39,394.64 |
|
BSE Index Return |
-0.75 |
-0.25 |
-0.41 |
-0.65 |
0.51 |
Liquidity Operation by RBI
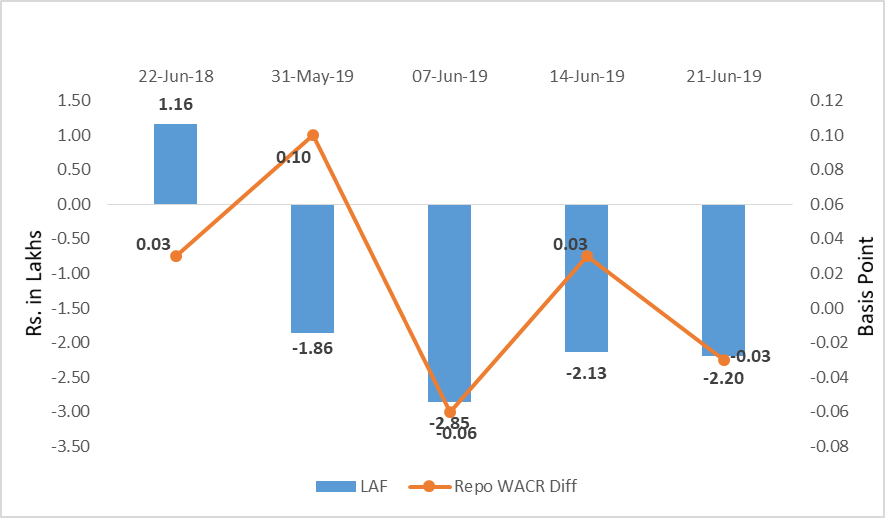
Source: RBI, Acuité Research; Note: Net injection (+) and Net absorption (-)
Corporate debt (in Rs. Lakh Cr)
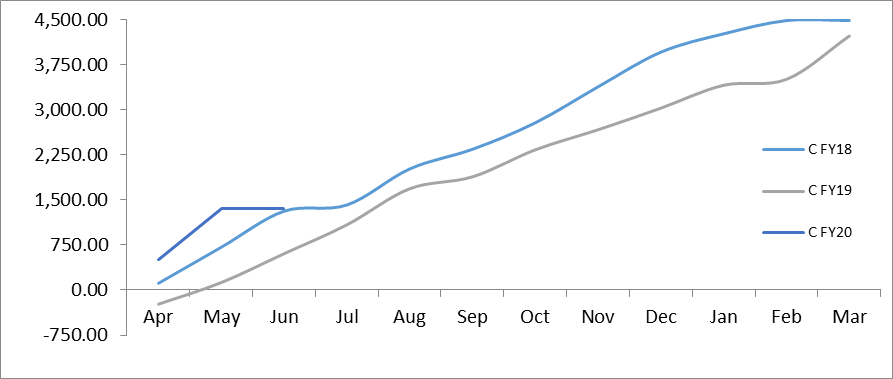
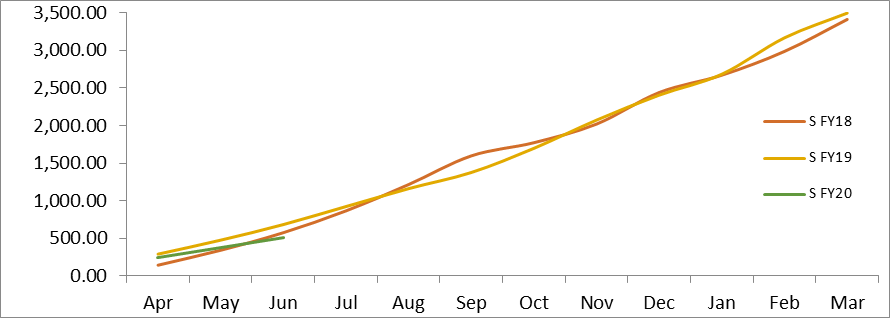
Net Debt Issuance by Centre and State Government (Rs. Billion)
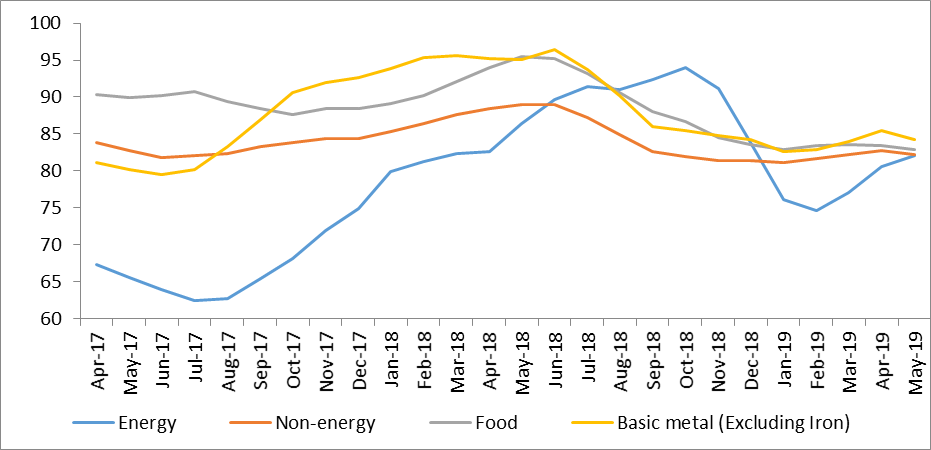
Commodity Price Index (3 Month Moving Average)
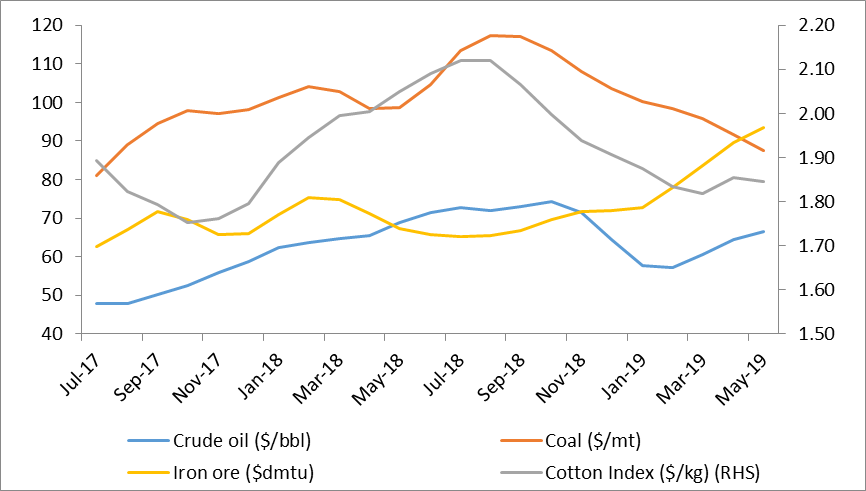
Commodity Price Movement (3 Month Moving Average)
USD-INR Movement
Source: RBI, Acuité Research
 +91 99698 98000
 info@acuite.in
 Follow us
 +91 22 49294000
 DOWNLOAD