Key Highlights:
Liquidity
The weighted average call money rate remains stable at 5.78% for last two weeks of June, 2019, which is three bps higher than the repo rate. On a daily basis, the banking sector had surplus liquidity of Rs. 80,000 cr. The daily liquidity condition has further increased to Rs. 1.5 lakh crore on July 8, 2019. This indicates WACR rate will drop to below the benchmark rate in July only and liquidity in the system is expected to remain in the at ex-ante positive. Growth in deposit has improved by 10 bps, whereas credit offtake has subsided by 30 bps during the week period. This also hints a further increase in liquidity in the system.
Capital Market
In the global capital market, the 10-year US G-Sec continues to remain at close to 2% for past five weeks owing to weak global economic outlook. In the domestic market, 10-year Indian G-Sec has been hovering at 6.9%. The bid-ask spread for the 10-year Indian G-Sec stands at 0.54 bps in June, 2019, which was at 0.77 bps a year earlier. This gives a sense of strong demand for Indian sovereign bond.
Currency Trend
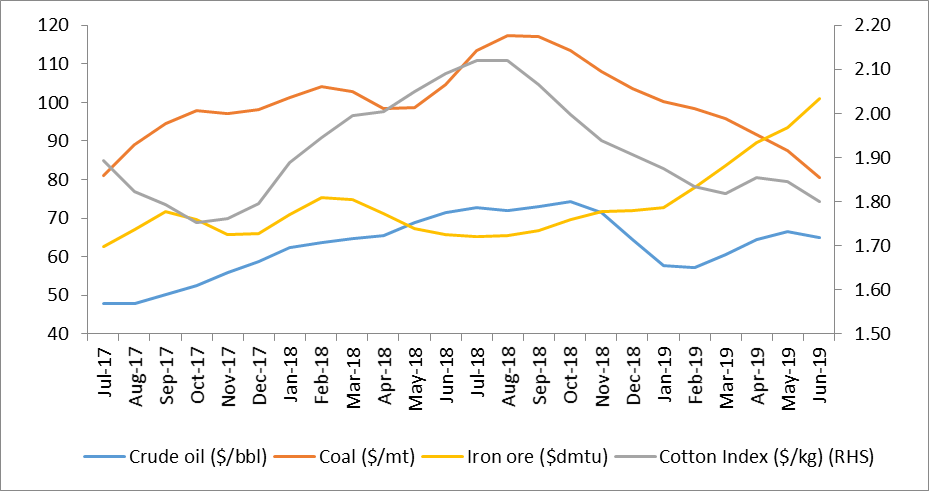
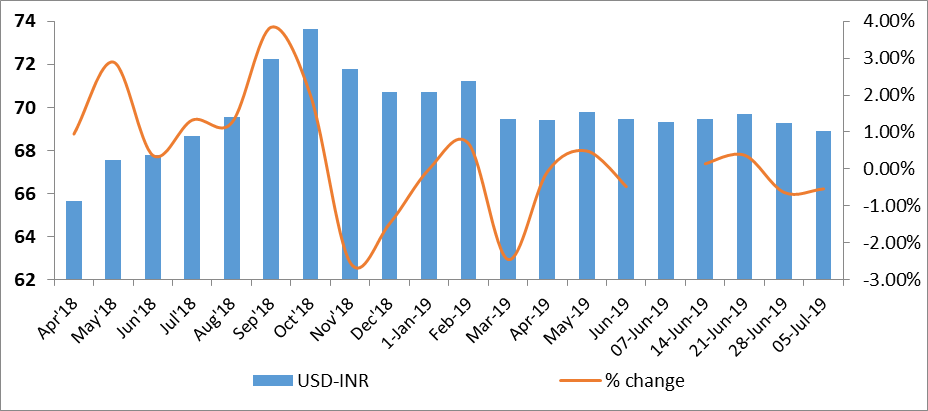
In the currency market, the forex reserve reached all time high of $427.6 billion with the increase in foreign currency assets. Indian rupee has been appreciating against the US dollar. Strong net capital inflows and lower commodity prices has been helping the Indian rupee to appreciate against the USD. Among the commodity, crude oil, coal and cotton prices on the downward trend. However, ironically, iron-ore price has been on upward price for past six months despite global weak demand.
Interest rates and ratio:
|
Interest Rate |
June 29 |
May 31 |
June 7 |
June 14 |
June 21 |
June 28 |
|
2018 |
2019 |
2019 |
2019 |
2019 |
2019 |
|
|
Policy Repo Rate |
6.25 |
6.00 |
5.75 |
5.75 |
5.75 |
5.75 |
|
Call Money Rate (WA) |
6.17 |
5.90 |
5.81 |
5.72 |
5.78 |
5.78 |
|
364-Day Treasury Bill Yield |
7.13 |
6.30 |
6.19 |
6.13 |
6.13 |
6.16 |
|
2-Yr Indian G-Sec |
7.67 |
6.27 |
6.21 |
6.22 |
6.29 |
6.17 |
|
10-Yr Indian G-Sec |
7.98 |
7.07 |
7.04 |
6.99 |
6.91 |
6.93 |
|
10-Yr US G-Sec |
2.82 |
2.08 |
2.08 |
2.06 |
2.01 |
2.04 |
|
AAA (Indian corporate) |
9.23 |
8.11 |
8.11 |
8.27 |
8.09 |
7.95 |
|
Spread in bps (10Yr Indian-US) |
516 |
499 |
496 |
493 |
490 |
489 |
|
Credit/Deposit Ratio |
72.26 |
- |
76.97 |
- |
77.25 |
- |
|
USD LIBOR (3 month) |
1.9333 |
2.3545 |
2.3460 |
2.3466 |
2.3415 |
2.3549 |
Acuité Portfolio Debt Instrument Benchmark Estimates (as on 10 June
2019):
|
Category |
10-Yr Corporate Yield to Maturity |
|
AAA* |
NA |
|
AA+ |
8.04% |
|
AA |
8.65% |
|
|
Deposit (In Rs. Lakh cr) |
Bank Credit (In Rs. Lakh cr) |
|
As on June 21, 2019 |
124.91 |
96.49 |
|
As on May 24,2019 |
124.99 |
96.22 |
|
As on June 22,2018 |
113.53 |
86.14 |
|
YTD (% change) |
-0.06% |
0.28% |
|
YoY (% change) |
10.02% |
12.02% |
Money Market
Performance
|
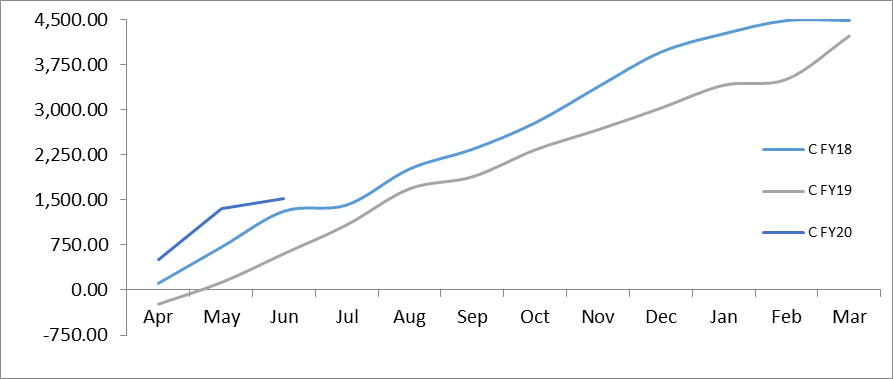
Commercial Paper (Fortnight): |
Outstanding (In Rs. Lakh cr) |
Amount issued (In Rs. Lakh cr) |
|
31-Mar-2019 |
4,830.8 |
1013.0 |
|
28-Feb-2019 |
5,208.1 |
900.8 |
|
31-Mar-2018 |
3,725.8 |
999.2 |
|
% Change (MoM) |
-7.24% |
12.45% |
|
% Change (YoY) |
29.66% |
1.38% |
Indices
|
|
06-Jul-18 |
07-Jun-19 |
14-Jun-19 |
21-Jun-19 |
05-Jul-19 |
|
NSE Index |
10,772.65 |
11,823.00 |
11,724.10 |
11,788.85 |
11,811.15 |
|
NSE Index Return |
0.54 |
-0.40 |
-0.84 |
0.55 |
0.19 |
|
BSE Index |
35,657.86 |
39,452.07 |
39,194.49 |
39,394.64 |
39,513.39 |
|
BSE Index Return |
0.66 |
-0.41 |
-0.65 |
0.51 |
0.30 |
Liquidity Operation by RBI
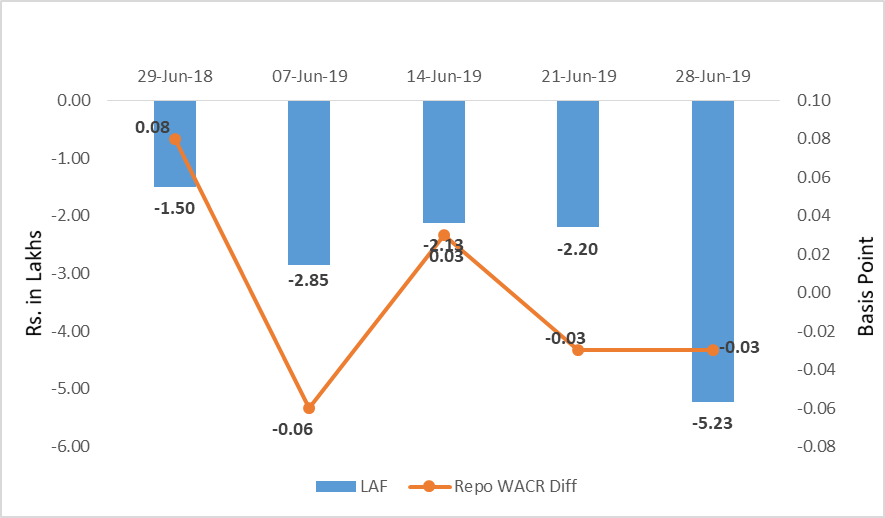
Source: RBI, Acuité Research; Note: Net injection (+) and Net absorption (-)
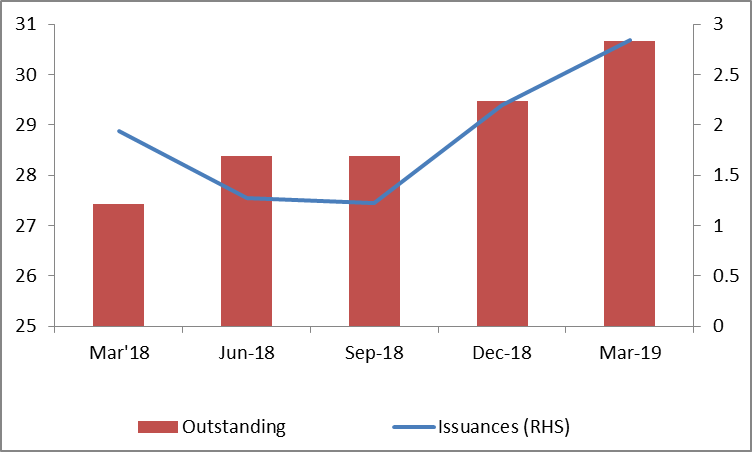
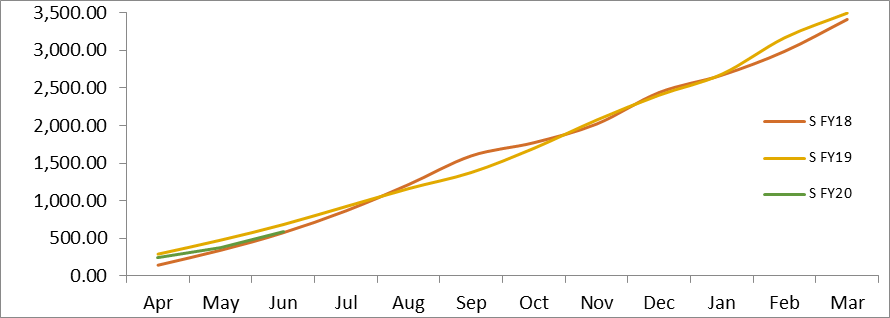
Corporate debt (in Rs. Lakh Cr)
Net Debt Issuance by Centre and State Government (Rs. Billion)
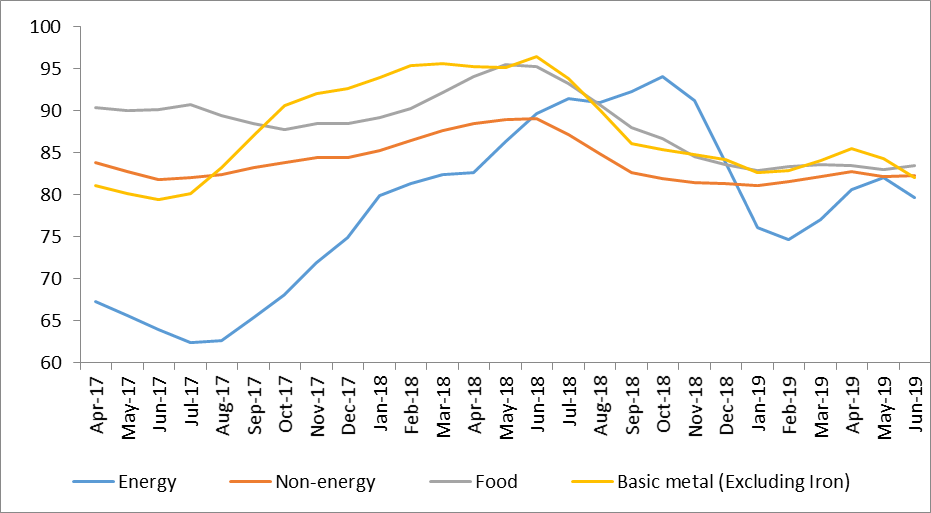
Commodity Price Index (3 Month Moving Average)
Commodity Price Movement (3 Month Moving Average)
USD-INR Movement
Source: RBI, Acuité Research
 +91 99698 98000
 info@acuite.in
 Follow us
 +91 22 49294000
 DOWNLOAD