Key Highlights:
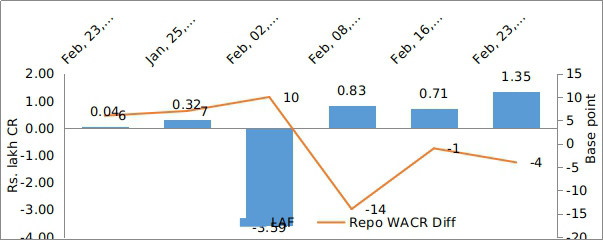
·The WACR- Repo spread stands (-) 4 bps indicating liquidity deficit
·RBI has infused Rs. 125 billion through OMO operations in order to improve the liquidity condition
·Currency in circulation (CiC) has surpassed Rs. 210 lakh crore mark in First week of March, 2019 and currently stands at 13.84% of M3
·The 3 month USD LIBOR rate has dropped by 16 bps to 2.59% during the month ending Fed 22, 2019
·The 10-year Indian G-Sec yield has dropped by 16 bps to 7.42% during the week ending Feb. 22, 2019
·Currency market has restored stability with the normalization in crude oil price
Liquidity
Liquidity condition in the domestic market continues to remains tight after the third week post rate cut. The WACR stands 4 bps higher than the benchmark interest rate. RBI has infused Rs. 125 billion through OMO operations to improve the liquidity condition. Currency in circulation (CiC) has surpassed the Rs. 210 lakh crore mark in First week of March, 2019 and currently stands at 13.84% of M3. It is noted that the CiC has increased by 0.4 lakh crore in last one month. A faster growth in CiC indicates strong consumption demand in the domestic market – such conditions will further deteriorate the systemic liquidity condition though. The credit offtake also remains strong with a 14.35% YoY expansion. From the global perspective, the liquidity condition in the global market has been improving - the 3 month USD LIBOR rate has dropped by 16 bps to 2.59% over a month, ending Fed 22, 2019.
Capital Market
The 10-year Indian G-Sec yield remains less attractive in 4th week of February, 2019. The 10 year G-Sec yield has dropped by 16 bps to 7.42% over a week period during Feb. 22, 2019. The fall in bond yield is primarily attributed to the RBI’s intervention through OMO operation in the previous week. Also, the yield curve is now matching the revised Repo rate of 6.25%. The 10-year US G-Sec yield, on the other hand, increased marginally by about 8 bps to 2.76% during the same time frame.
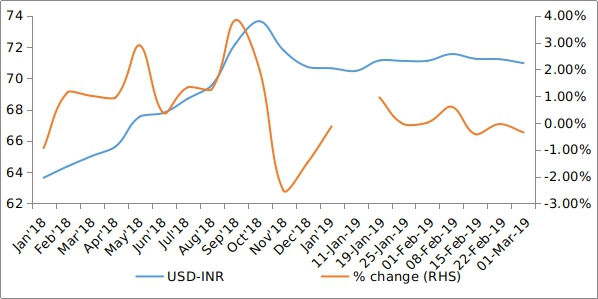
Currency Trend
The USD-INR currency pair seems to stabilize at 71 for past seven weeks. On account of adverse global financial environment and volatile commodity prices, the currency pair was highly volatile during August to November, 2018. However, currency market saw a restoration of stability with the normalization in crude oil prices, especially as Libyan supplies enter the system.
Interest rates and ratio:
|
Interest Rate |
Feb.,23 2018 |
Jan.,25 2019 |
Feb.,01 2019 |
Feb.,08 2019 |
Feb.,15 2019 |
Feb.,22 2018 |
|
Policy Repo Rate |
6.00 |
6.50 |
6.50 |
6.25 |
6.25 |
6.25 |
|
Call Money Rate (WA) |
5.94 |
6.43 |
6.40 |
6.39 |
6.26 |
6.29 |
|
364-Day Treasury Bill Yield |
6.64 |
6.82 |
6.78 |
6.78 |
6.51 |
6.53 |
|
2-Yr Indian G-Sec |
6.89 |
7.02 |
6.80 |
6.75 |
6.80 |
6.67 |
|
10-Yr Indian G-Sec |
7.64 |
7.35 |
7.38 |
7.34 |
7.58 |
7.42 |
|
10-Yr US G-Sec |
2.86 |
2.68 |
2.63 |
2.66 |
2.68 |
2.76 |
|
Spread in bps (10Yr Indian-10Yr US) |
478 |
467 |
475 |
468 |
490 |
466 |
|
AAA Indian Corporate |
8.03 |
8.62 |
8.67 |
8.70 |
8.78 |
8.32 |
|
AA Indian Corporate |
8.81 |
- |
- |
- |
- |
- |
|
Spread AAA to10 YR Indian bond |
39 |
127 |
129 |
136 |
120 |
90 |
|
Credit/Deposit Ratio |
- |
- |
77.79 |
- |
77.58 |
- |
|
USD LIBOR (3 month) |
2.79 |
2.75 |
- |
- |
2.68 |
2.59 |
Source: RBI, Investing.com
Acuité Portfolio Debt Instrument Benchmark Estimates (as on 04 March 2019):
|
Category |
10-Yr Corporate Yield to Maturity |
|
AAA* |
8.32% |
|
AA+ |
8.39% |
|
AA |
8.85% |
Source: Acuité Research; # Discount Factor: 0.0625; *Outside Benchmark
|
|
Deposit (In Rs. Lakh cr) |
Bank Credit (In Rs. Lakh cr) |
|
As on Feb 15, 2019 |
1,21,211.8 |
94,034.9 |
|
As on Feb 01, 2019 |
1,21,227.6 |
94,298.5 |
|
As on Feb 16, 2018 |
1,10,022.7 |
82,232.1 |
|
YTD (% change) |
-0.01% |
-0.28% |
|
YoY (% change) |
10.17% |
14.35% |
Source: RBI
Money Market Performance
|
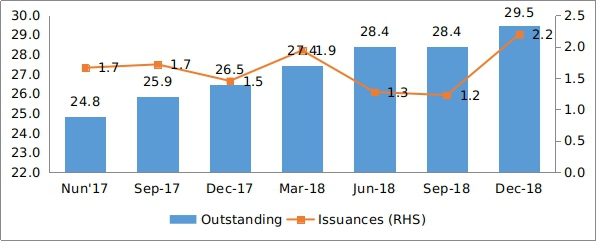
Commercial Paper (Fortnight): |
Outstanding (In Rs. Lakh cr) |
Amount issued (In Rs. Lakh cr) |
|
15-Feb-2019 |
5,242.3 |
1,035.5 |
|
31-Jan-2018 |
5,287.4 |
1,073.9 |
|
15-Feb-2018 |
4,886.3 |
1,037.7 |
|
% Change (MoM) |
-0.85% |
-3.58% |
|
% Change (YoY) |
7.29% |
-0.22% |
Source: RBI
Indices
|
|
01-Mar-18 |
08-Feb-19 |
15-Feb-19 |
22-Feb-19 |
01-Mar-19 |
|
NSE Index |
10,113.70 |
10,943.60 |
10,724.40 |
10,789.85 |
10,863.50 |
|
NSE Index Return |
-3.61 |
-1.14 |
-0.2 |
0.51 |
0.66 |
|
BSE Index |
32,968.68 |
36,546.48 |
35,808.95 |
35,871.48 |
36,063.81 |
|
BSE Index Return |
-.356 |
-1.15 |
-0.19 |
-0.07 |
0.55 |
Liquidity Operation by RBI:
 Source: RBI
Note: Net injection (+) and Net absorption (-)
Net Debt Issuance by Centre and State Government:
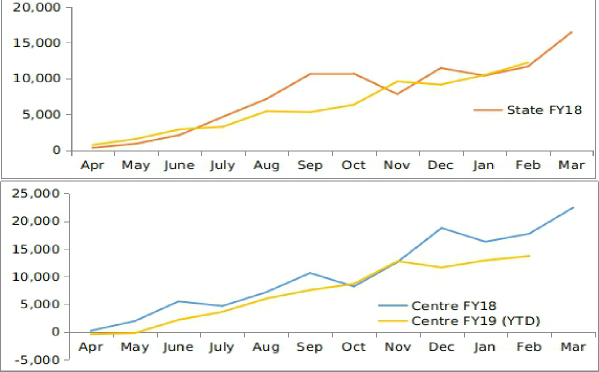 Source: Acuité Research, RBI
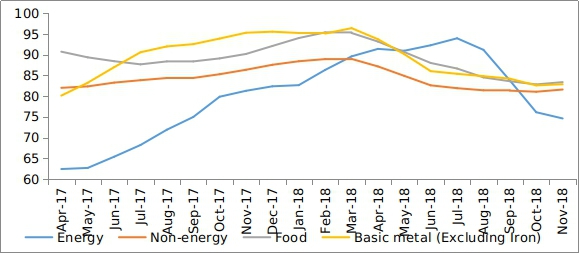
Commodity Price Index (3 Month Moving Average):
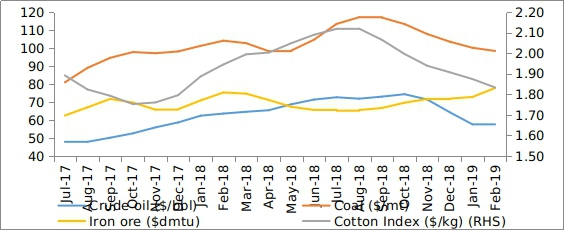
Commodity Price Movement (3 Month Moving Average):
Corporate debt (in Rs. Lakh Cr):
USD-INR Movement:
 Source: RBI, Acuité Research
 +91 99698 98000
 info@acuite.in
 Follow us
 +91 22 49294000
 DOWNLOAD