Key Highlights:
Liquidity
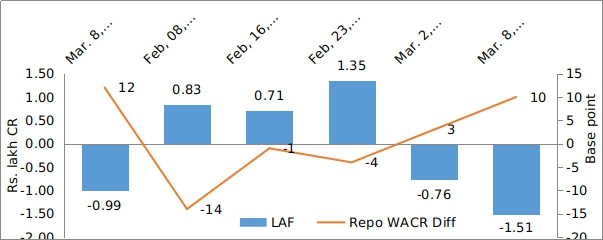
After four weeks, the liquidity situation has improved to a comfortable level. The Repo-WACR differential stands at 10 bps during first week of March, 2019. The surfeit in liquidity is result of RBI’s OMO operation and accumulation of forex reserve. While the RBI has infused Rs. 125 billion through OMO during the said period, its forex reserve accumulation has been increasing for over five weeks, reached $402 billion during first week of March, 2019. It is known that increase in forex reserve positively impact the primary liquidity (narrow money).
Capital Market:
The domestic capital market also remains stable for past two weeks. The 10-year G-Sec yield remains at 7.36% for second week in March, 2019. The benchmark bond was trading at 7.69% a year earlier. The factor that is currently supressing the sovereign yield is RBI’s OMO operations along with foreign demand. On the global front, the 10-year US G-Sec yield has been softening for the past two weeks and reached 2.59% during first week of March, 2019. The global benchmark bond yield is 26 bps lower in a year ever since Fed hinted a pause in the rate hike cycle. Moreover, US CPI inflation rate has decelerated to 1.5% in Feb, 2019 from a peak of 2.5% in Oct, 2018 – giving this narrative, strength.
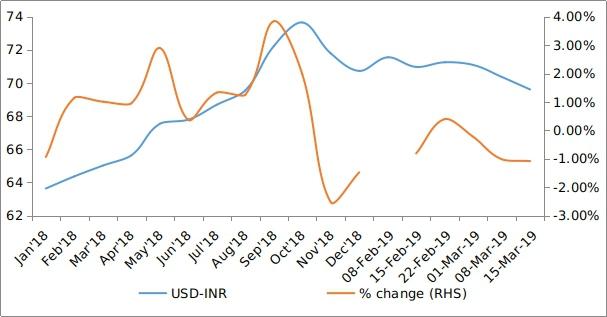
Currency Trend:
The Indian rupee has been strengthening against the US dollar for past three weeks and reached eight month high of 69.61 during second week of March, 2019. The factors contributing to the appreciation of Indian rupee are strong capital inflows and fall in trade deficit. Given the higher capital inflow, India’s forex reserve has surged to a five week high of $402 billion.
Interest rates and ratio:
| Interest Rate | Mar.,092018 | Feb.,082019 | Feb.,152019 | Feb.,222018 | Mar.,012019 | Mar.,082019 |
| Policy Repo Rate | 6.00 | 6.25 | 6.25 | 6.25 | 6.25 | 6.25 |
| Call Money Rate (WA) | 5.88 | 6.39 | 6.26 | 6.29 | 6.22 | 6.15 |
| 364-Day Treasury Bill Yield | 6.66 | 6.78 | 6.51 | 6.53 | 6.55 | 6.51 |
| 2-Yr Indian G-Sec | 6.89 | 6.75 | 6.80 | 6.67 | 6.64 | 6.55 |
| 10-Yr Indian G-Sec | 7.69 | 7.34 | 7.58 | 7.42 | 7.37 | 7.36 |
| 10-Yr US G-Sec | 2.85 | 2.66 | 2.68 | 2.76 | 2.64 | 2.59 |
| Spread in bps (10Yr Indian-10Yr US) | 484 | 468 | 490 | 466 | 473 | 477 |
| AAA Indian Corporate | 8.21 | 8.70 | 8.78 | 8.32 | 8.61 | 8.58 |
| AA Indian Corporate | 8.18 | - | - | - | 8.56 | - |
| Spread AAA to10 YR Indian bond | 52 | 136 | 120 | 90 | 124 | 122 |
| Credit/Deposit Ratio | 74.61 | - | 77.89 | - | 77.92 | - |
| USD LIBOR (3 month) | 2.59 | - | 2.68 | 2.59 | 2.59 | 2.62 |
Acuité Portfolio Debt Instrument Benchmark Estimates (as on 04 March 2019):
|
Category |
10-Yr Corporate Yield to Maturity |
|
AAA* |
8.32% |
|
AA+ |
8.39% |
|
AA |
8.85% |
|
Deposit (In Rs. Lakh cr) |
Bank Credit (In Rs. Lakh cr) |
|
| As on Mar 01, 2019 | 1,22,301.8 | 95,294.8 |
| As on Jan 04, 2019 | 1,20,337.6 | 93,374.5 |
| As on Mar 02, 2018 | 1,11,370.5 | 83,190.3 |
| YTD (% change) | 1.63% | 2.06% |
| YoY (% change) | 9.82% | 14.55% |
Money Market Performance
| Commercial Paper (Fortnight): | Outstanding (In Rs. Lakh cr) | Amount issued (In Rs. Lakh cr) |
| 28-Feb-2019 | 5,208.1 | 900.8 |
| 15-Feb-2019 | 5,242.3 | 1,035.5 |
| 15-Feb-2018 | 4886.3 | 1037.7 |
| % Change (MoM) | -0.65% | -13.01% |
| % Change (YoY) | 6.59% | -13.19% |
Indices
| 16-Mar-18 | 22-Feb-19 | 01-Mar-19 | 08-Mar-19 | 15-Mar-19 | |
| NSE Index | 10,195.15 | 10,789.85 | 10,863.50 | 11,035.40 | 11,426.85 |
| NSE Index Return | -0.31 | 0.51 | 0.66 | -0.21 | 0.74 |
| BSE Index | 33,176.00 | 35,871.48 | 36,063.81 | 36,671.43 | 38,024.32 |
| BSE Index Return | -0.39 | -0.07 | 0.55 | -0.15 | 0.71 |
 Source: RBI
Note: Net injection (+) and Net absorption (-)
Net Debt Issuance by Centre and State Government:
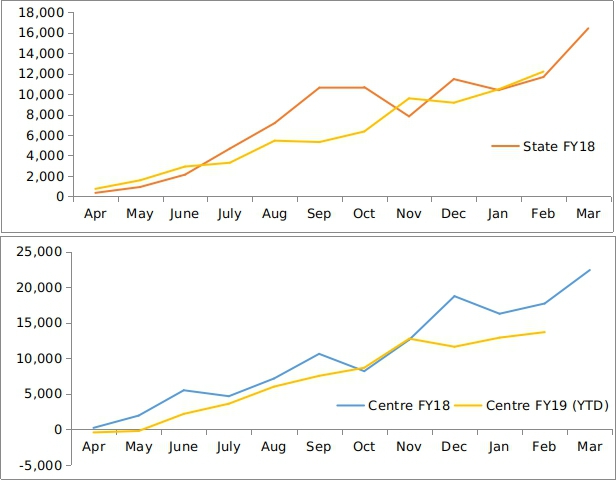 Source: Acuité Research, RBI
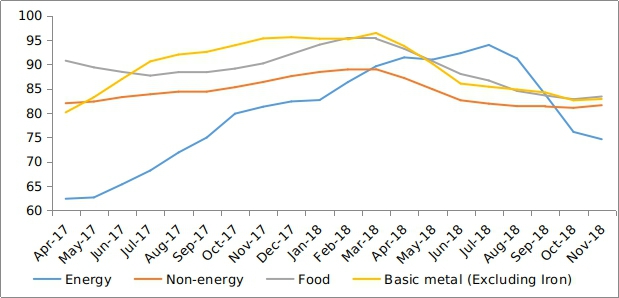
Commodity Price Index (3 Month Moving Average):
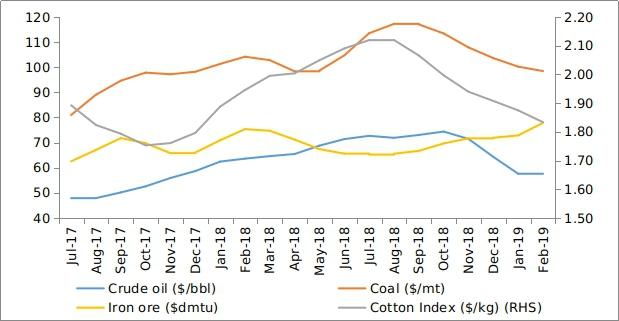
Commodity Price Movement (3 Month Moving Average):
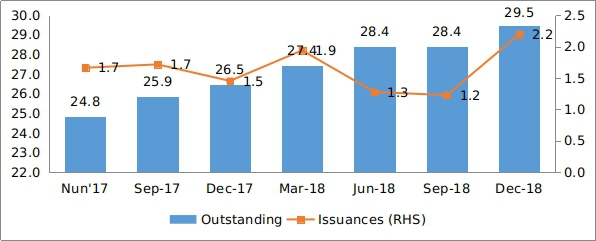
Corporate debt (in Rs. Lakh Cr):
USD-INR Movement:
 Source: RBI, Acuité Research
 +91 99698 98000
 info@acuite.in
 Follow us
 +91 22 49294000
 DOWNLOAD