Key Highlights:
Liquidity
Liquidity in the banking sector has marginally improved during the second week of May, 2019. The spread between repo and call money rate stands at 5 bps during the said period, which was in the negative trajectory over the past three weeks. The credit offtake has declined to 12.9% during the second fortnight of April, 2019. Fall in credit offtake hints the liquidity condition to improve in coming weeks.
Capital Market
The 10 year US sovereign yield has reduced to 2.47% during the second week of May, 2019. The sovereign bond has been witnessing strong demand as investors are concern about global economic outlook after the US-China trade war. On the Indian bond market perspective, the 10-year G-Sec yield has been hovering around 7.4% over past four weeks. The Indian sovereign bond has become more attractive for the investors as the spread between 10 year Indian and US bond remain high.
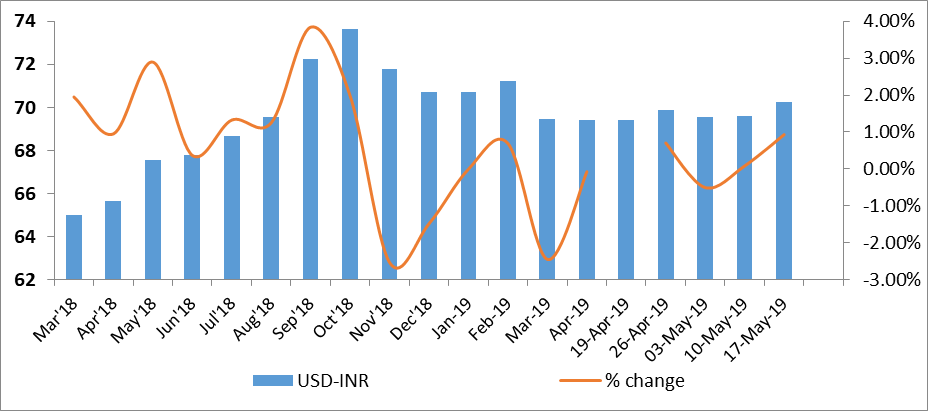
Currency Trend
The currency of emerging economies including India has been continued to loosing value against the US dollar. The Indian rupee has depreciated to ten week low of 70.26 during the second week of May, 2019. In post US-China trade tension, China is expected to devalue its currency to improve their trade competitiveness. This will drag entire currency market into the ground.
Interest rates and ratio:
|
Interest Rate |
May 11 |
Apr 12 |
Apr 19 |
Apr 26 |
May 3 |
May 10 |
|
2018 |
2019 |
2019 |
2019 |
2019 |
2019 |
|
|
Policy Repo Rate |
6.00 |
6.00 |
6.00 |
6.00 |
6.00 |
6.00 |
|
Call Money Rate (WA) |
5.90 |
6.00 |
6.05 |
6.16 |
6.08 |
5.95 |
|
364-Day Treasury Bill Yield |
6.67 |
6.39 |
6.45 |
6.50 |
6.51 |
6.54 |
|
2-Yr Indian G-Sec |
7.63 |
6.73 |
6.77 |
6.76 |
6.72 |
6.59 |
|
10-Yr Indian G-Sec |
7.73 |
7.40 |
7.42 |
7.41 |
7.40 |
7.41 |
|
10-Yr US G-Sec |
2.97 |
2.56 |
2.56 |
2.50 |
2.53 |
2.47 |
|
AAA (Indian corporate) |
8.61 |
8.49 |
8.81 |
8.69 |
8.65 |
8.50 |
|
Spread in bps (10Yr Indian-10Yr US) |
476 |
484 |
486 |
491 |
487 |
494 |
|
Credit/Deposit Ratio |
75.03 |
76.97 |
|
77.05 |
|
|
|
USD LIBOR (3 month) |
1.7050 |
2.3885 |
2.3856 |
2.4000 |
2.3731 |
2.3589 |
Acuité Portfolio Debt Instrument Benchmark Estimates (as on 10 May
2019):
|
Category |
10-Yr Corporate Yield to Maturity |
|
AAA* |
NA |
|
AA+ |
8.36% |
|
AA |
8.87% |
|
|
Deposit (In Rs. Lakh cr) |
Bank Credit (In Rs. Lakh cr) |
|
As on Apr 26, 2019 |
124.86 |
96.21 |
|
As on Mar 29,2019 |
125.73 |
97.69 |
|
As on Apr 27,2018 |
113.81 |
85.17 |
|
YTD (% change) |
-0.69% |
-1.51% |
|
YoY (% change) |
9.71% |
12.96% |
Money Market
Performance
|
Commercial Paper (Fortnight): |
Outstanding (In Rs. Lakh cr) |
Amount issued (In Rs. Lakh cr) |
|
31-Mar-2019 |
4,830.8 |
1013.0 |
|
28-Feb-2019 |
5,208.1 |
900.8 |
|
31-Mar-2018 |
3,725.8 |
999.2 |
|
% Change (MoM) |
-7.24% |
12.45% |
|
% Change (YoY) |
29.66% |
1.38% |
Indices
|
|
18-May-18 |
26-Apr-19 |
03-May-19 |
10-May-19 |
17-May-19 |
|
NSE Index |
10,596.40 |
11,754.65 |
11,712.25 |
11,278.90 |
11,407.15 |
|
NSE Index Return |
-1.94 |
0.02 |
-0.36 |
-3.70 |
1.14 |
|
BSE Index |
34,848.30 |
39,067.33 |
38,963.26 |
37,462.99 |
37,930.77 |
|
BSE Index Return |
-1.93 |
-0.19 |
-0.27 |
-3.85 |
1.25 |
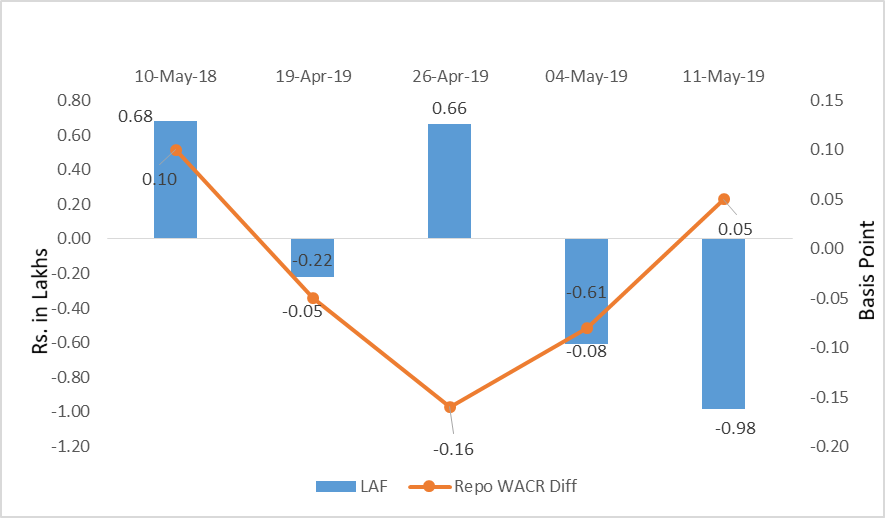 Source: RBI, Acuité Research; Note: Net injection (+) and Net absorption (-)
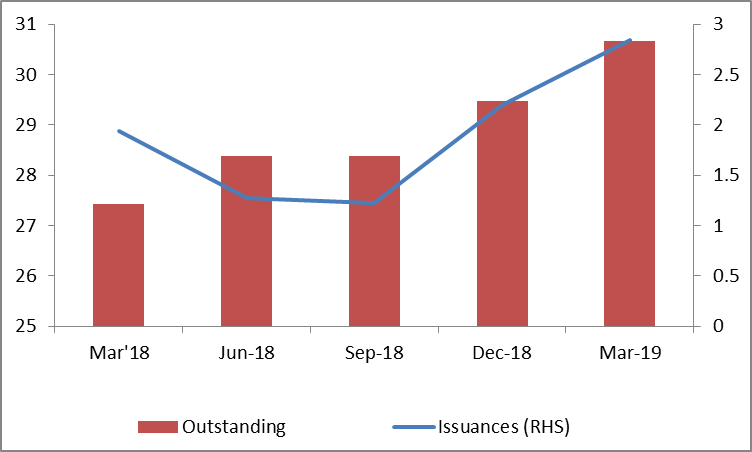
Corporate debt (in Rs. Lakh Cr):
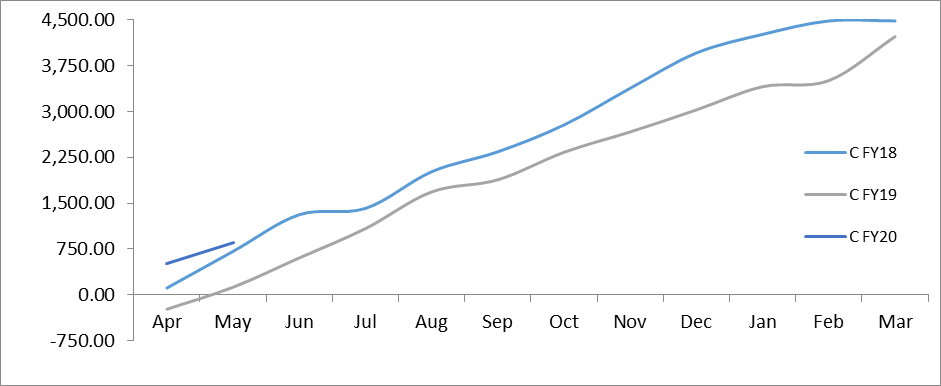
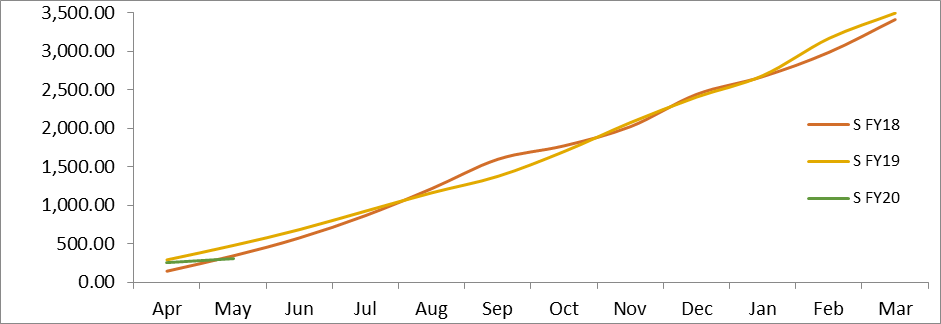
Net Debt Issuance by Centre and State Government (Rs. Billion):
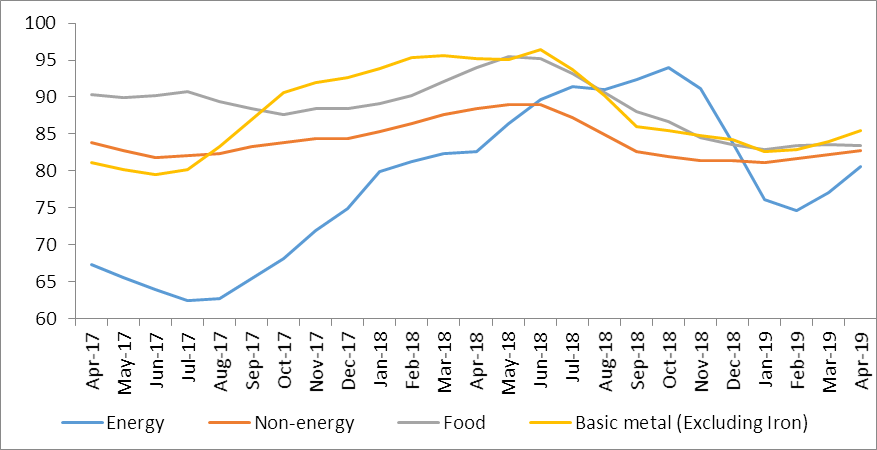
Commodity Price Index (3 Month Moving Average):
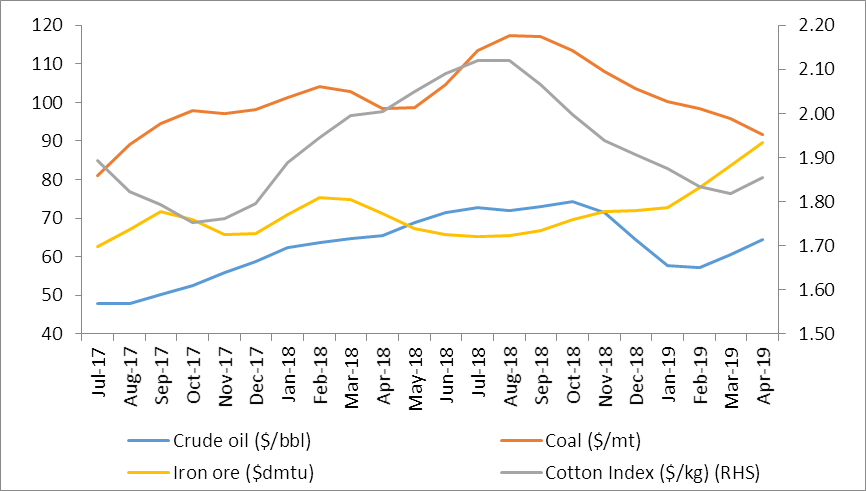
Commodity Price Movement (3 Month Moving Average):
USD-INR Movement:
 Source: RBI, Acuité Research
 +91 99698 98000
 info@acuite.in
 Follow us
 +91 22 49294000
 DOWNLOAD