Key Highlights:
Liquidity
The weighted average call money rate stands seven bps lower than the repo rate during 4th week of May, 2019. This is for third consecutive weeks, WACR stands below 5 bps lower than the benchmark rate. In post general election result, the capital inflows have increased significantly. As a result, on a daily basis, the WACR stands 42 bps lower than repo on June 03, 2019. This gives a sense of liquidity situation to be improved significantly.
Capital Market
On the global capital market perspective, the 10-year US G-Sec bond yield declined to 2.13% during 4th week of May. Over a month, the yield has reduced by 40bps. Interestingly, the 10-year treasury yield stands (-)0.07 bps less than 1-year T-bill rate, which was 60 bps higher a year earlier. Due to geo-political uncertainty, the demand for the US 10-year bond has increased significantly. On a domestic market side, the 10-year sovereign yield has declined by 7.27% during the 4th week of May. The Indian G-Sec becomes more attractive as spread between 10-year India and US sovereign yield increased to 514 bps.
Currency Trend
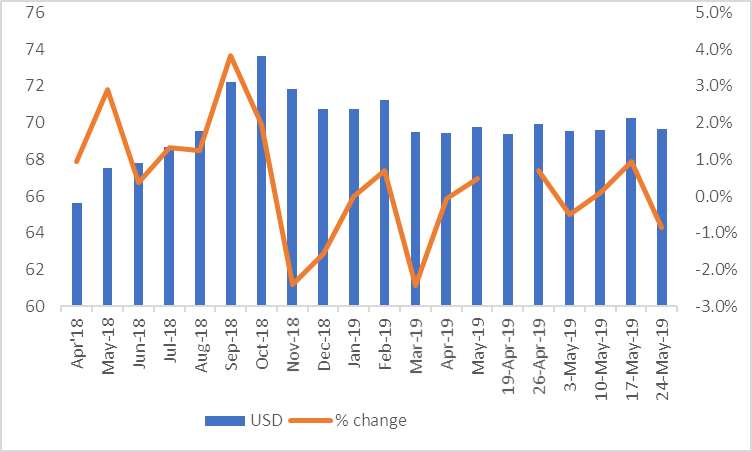
The Indian rupee has reached 69.66 against the US dollar at the end of 4thweek of May, 2019. The currency pair had reached all-time high of 73.6 in October 2018. India’s foreign exchange reserve has also reached all-time high of $420 billion at the end of May 24, 2019. In recent weeks, higher FII inflows have been strengthening value of Indian rupee.
Interest
rates and ratio:
|
Interest Rate
|
May 25
|
Apr 26
|
May 3
|
May 10
|
May 17
|
May 24
|
|
2018
|
2019
|
2019
|
2019
|
2019
|
2019
|
|
|
Policy Repo Rate
|
6.00
|
6.00
|
6.00
|
6.00
|
6.00
|
6.00
|
|
Call Money Rate (WA)
|
5.94
|
6.16
|
6.08
|
5.95
|
5.95
|
5.93
|
|
364-Day Treasury Bill Yield
|
6.95
|
6.50
|
6.51
|
6.54
|
6.47
|
6.41
|
|
2-Yr Indian G-Sec
|
7.56
|
6.76
|
6.72
|
6.59
|
6.50
|
6.40
|
|
10-Yr Indian G-Sec
|
7.95
|
7.44
|
7.43
|
7.46
|
7.41
|
7.27
|
|
10-Yr US G-Sec
|
2.90
|
2.53
|
2.47
|
2.39
|
2.32
|
2.13
|
|
AAA (Indian corporate)
|
8.71
|
8.69
|
8.65
|
8.50
|
8.41
|
8.42
|
|
Spread in bps (10Yr Indian-10Yr US)
|
505
|
491
|
496
|
507
|
509
|
514
|
|
Credit/Deposit Ratio
|
75.36
|
77.07
|
|
76.90
|
|
|
|
USD LIBOR (3 month)
|
1.7085
|
2.4000
|
2.3731
|
2.3589
|
2.3558
|
2.3563
|
Acuité Portfolio Debt Instrument
Benchmark Estimates (as on 6th June 2019):
|
Category
|
10-Yr Corporate Yield to Maturity
|
|
AAA*
|
NA
|
|
AA+
|
8.04%
|
|
AA
|
8.65%
|
|
|
Deposit (In Rs. Lakh cr)
|
Bank Credit (In Rs. Lakh cr)
|
|
As on May 10, 2019
|
125.17
|
96.26
|
|
As on Apr 26,2019
|
124.84
|
96.21
|
|
As on May 11,2018
|
113.43
|
85.21
|
|
YTD (% change)
|
0.26%
|
0.05%
|
|
YoY (% change)
|
10.35%
|
12.97%
|
Money Market
Performance
|
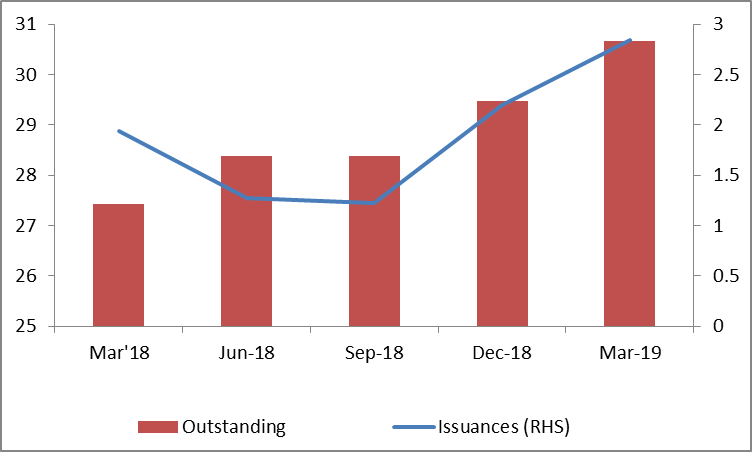
Commercial Paper (Fortnight):
|
Outstanding (In Rs. Lakh cr)
|
Amount issued (In Rs. Lakh cr)
|
|
31-Mar-2019
|
4,830.8
|
1013.0
|
|
28-Feb-2019
|
5,208.1
|
900.8
|
|
31-Mar-2018
|
3,725.8
|
999.2
|
|
%
Change (MoM)
|
-7.24%
|
12.45%
|
|
%
Change (YoY)
|
29.66%
|
1.38%
|
Indices
|
|
08 Jun 18 |
17 May 19 |
24 May 19 |
31 May 19 |
07 Jun 19 |
|
NSE Index |
10,767.65 |
11,407.15 |
11,844.10 |
11,922.80 |
11,870.65 |
|
NSE Index Return |
0.67 |
1.14 |
3.83 |
0.66 |
-0.44 |
|
BSE Index |
35,443.67 |
37,930.77 |
39,434.72 |
39,714.20 |
39,615.90 |
|
BSE Index Return |
0.61 |
1.25 |
3.96 |
0.71 |
-0.25 |
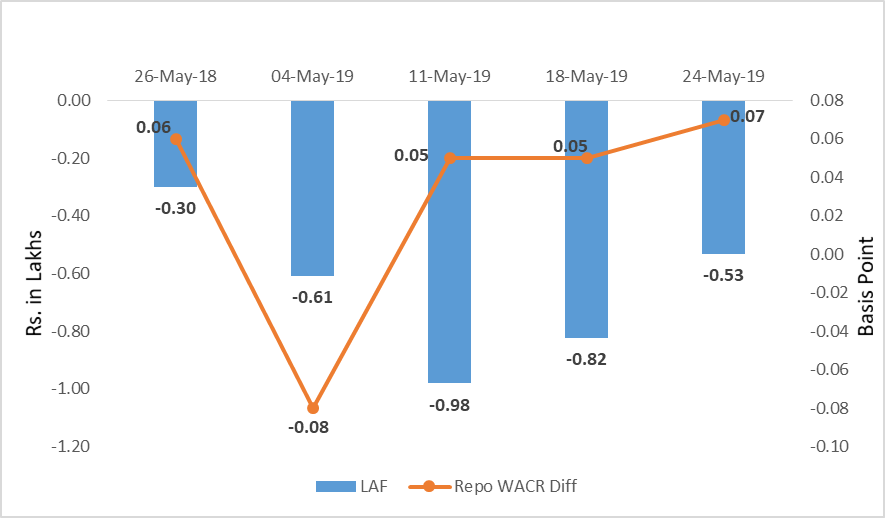 Source: RBI, Acuité Research; Note: Net injection (+) and Net absorption (-)
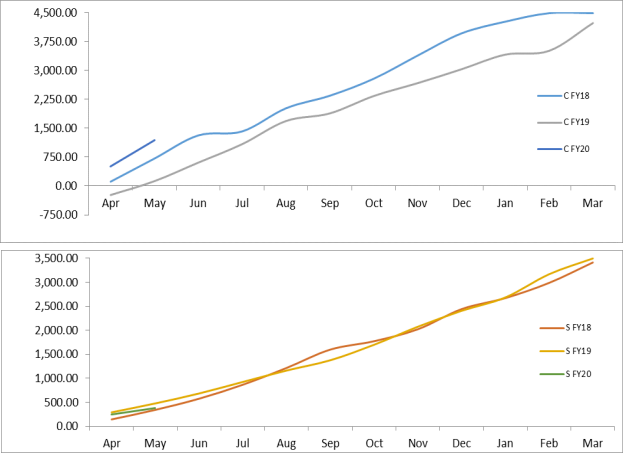
Net Debt Issuance by Centre and State Government (Rs. Billion):
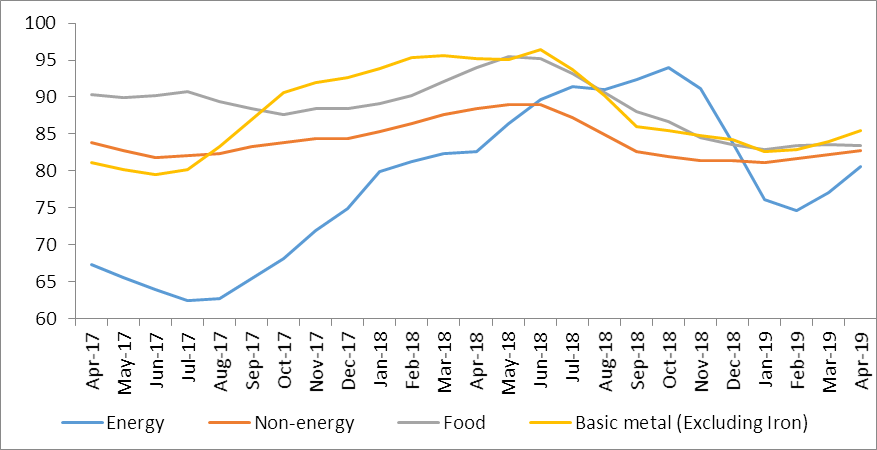
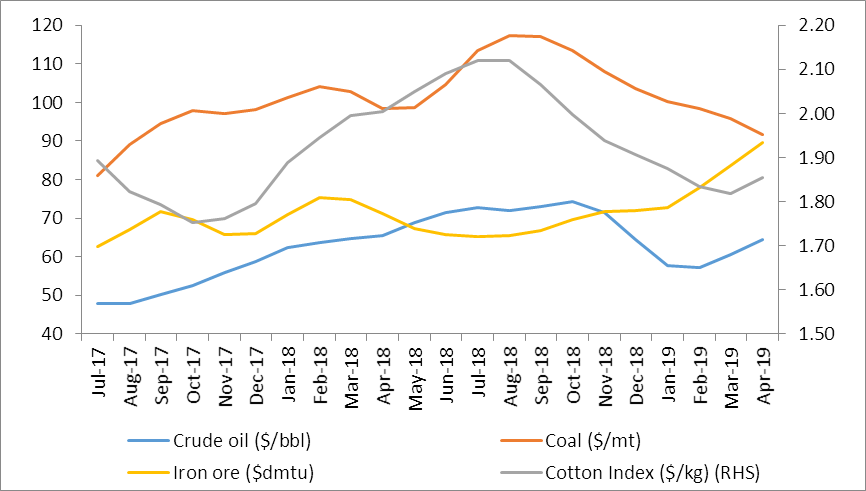
Commodity Price Index (3 Month Moving Average):
Commodity Price Movement (3 Month Moving Average):
Corporate debt (in Rs. Lakh Cr):
USD-INR Movement:
 Source: RBI, Acuité Research
 +91 99698 98000
 info@acuite.in
 Follow us
 +91 22 49294000
 DOWNLOAD