Impact: Neutral (Overall State Macros)
Brief: The 14th Finance Commission has offered states 10% additional revenue, as devolved from central taxes. State development expenditure has increased as a result leading to rising fiscal deficit and accompanied debt burden
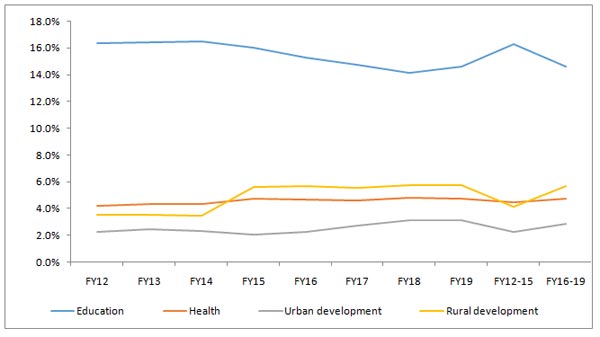
As per our analysis of the implications of the 14th Finance Commission on state finances, state developmental expenditure has increased by 100 bps (1%) since implementation. Overall development expenditure has averaged 63.7% (of total expenditure) in post implementation period as compared to 62.1% in the pre implementation period (four-year average). The largest decline is seen in the expenditure on Education (the largest recipient of state expenditure), which has averaged 14.6% in the period as compared to 16.3% in the pre implementation period. We believe this to be driven by the central Government taking over the education responsibility. Compensating, the big gainer for state spending has been Rural Development, which has seen its share jump by 160 bps (1.6%) to 5.7% in the post implementation period. Urban Development and Health have seen minor gains.
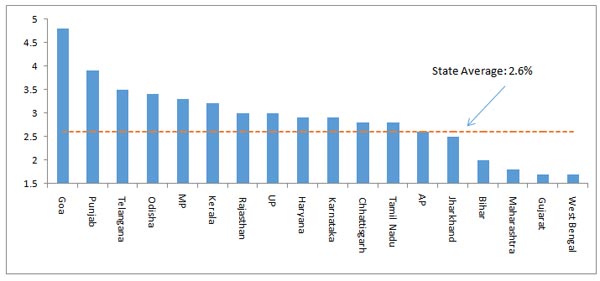
Devolution of 42% of central taxes (as against 32% as per 13th Finance Commission recommendations) to states has been paramount in the latter's increased confidence. With greater access to money and fixing of the fiscal deficit target at 3% (of GSDP), states have been liberally keeping up with social commitments. As a result of this, average Gross Fiscal Deficit (GFD) had increased from 2.62% in FY15 to 3.06% in FY16 (the year of implementation). Consequently, the state GFD has averaged 3.26% over the past three years (despite adopting UDAY scheme). Since the additional money (devolved from the Center) could be easily used for interest payment (improving interest coverage), the overall debt too increased significantly. The Debt to GSDP ratio has been averaging at nearly 18% in the post implementation period as compared to just 15.1% in the previous period. Generous central support (including grants-in-aid) meant that overall interest payment burden (as a percent of total expenditure) remained stable somewhat. Best performing states in terms of GFD management are Bihar, Maharashtra, Gujarat and Bangla (averaging 1.7% of GSDP) while worst performing states are Goa, Punjab, Telangana and Odisha (averaging around 4% of GSDP). Case in point here are the so called BIMARU states. Poorer states that have performed well in this situation are therefore helped by higher central allocation for both revenue as well as capital expenditure.
With the implementation of the GST, while the devo lution formula remains the same, the Integrated Goods and Services Tax (IGST) has been a bone of contention. Even though it is understood that the Central GST and State GST formula has no complication and distribution is fixed, the fate of the bulging IGST kitty is still uncertain. It has been decided that both center and states will get an equal share, a clear cut formula is yet to be worked upon. The IGST basically subsumes the interstate tax - with the final tax originating from the terminal state that consumes that good/ service (irrespective of its origin). This means that weal thier states will continue to be the highest generators of the IGST given their superior consumption power and therefore principal sources of the generous central support to poorer and less productive states.
Gross Fiscal Deficit (GFD) as a percent of GSDP among States
Key State Performance Metrics: Pre and Post 14th Finance Commission Implementation
| State GFD/GSDP | Center GFD/GDP | State Debt/GSDP | Center Debt/GDP | |
| 2011-12 | 1.93% | 5.91% | 15.53% | 38.93% |
| 2012-13 | 1.97% | 4.93% | 14.98% | 39.64% |
| 2013-14 | 2.21% | 4.48% | 14.88% | 39.39% |
| 2014-15 | 2.62% | 4.10% | 15.39% | 39.59% |
| 2015-16 | 3.06% | 3.87% | 17.08% | 40.07% |
| 2016-17 | 3.50% | 3.51% | 18.16% | 39.14% |
| 2017-18 (RE) | 3.07% | 3.55% | 18.49% | 39.76% |
Evolving share of social expenditure (as a % of total expenditure)
 +91 99698 98000
 info@acuite.in
 Follow us
 +91 22 49294000
 DOWNLOAD