Key Highlights:
Liquidity:
Liquidity condition has stabilized positively. The Repo WACR differential stands between 7 to 12 bps over the past five weeks. The recent development in the liquidity condition is a result of RBI’s intervention through open market operation and improvement in global financial market. However, acceleration in LIBOR rate is an indication of tightening global financial condition. In the domestic market, credit deposit ratio continue to remain high as it reached 77.3 in 4th week of November, 2018.
Capital Market:
In capital market, as Fed indicated pause on rate hike cycle resulted in the US 10 year G-Sec bond yield to fall to a four month low level. Fall in T bill issuance also reduce short term as well as long term bond yields. In domestic market, Indian 10 year G-Sec bond yield has fallen to an eight month low level. The factors behind this development are trim in expenditure to maintain fiscal deficit and positive development in global geo-political situations.
Currency Trend:
With stability in global financial market, the currency market also shows a sign of stability. The USD-INR currency pair is hovering at around 71.10 for past two weeks. However, domestic political uncertainty would cause volatile in the currency pair in the coming weeks. However, in a long term, subsiding commodity prices will help in strengthening domestic currency.
Interest rates and ratio
| Interest Rate | Nov.24, 2017 | Nov.02, 2018 | Nov.10, 2018 | Nov.16, 2018 | Nov.23, 2018 | Nov.30, 2018 |
| Policy Repo Rate | 6.00 | 6.50 | 6.50 | 6.50 | 6.50 | 6.50 |
| Call Money Rate (WA) | 5.89 | 6.43 | 6.43 | 6.38 | 6.42 | 6.39 |
| 364-Day Treasury Bill Yield | 6.29 | 7.48 | 7.42 | 7.33 | 7.27 | 7.22 |
| 2-Yr Indian G-Sec | 2.34 | 7.43 | 7.42 | 7.35 | 7.3 | 7.24 |
| 10-Yr Indian G-Sec | 7.21 | 7.84 | 7.81 | 7.85 | 7.77 | 7.64 |
| 10-Yr US G-Sec | 2.34 | 3.18 | 3.08 | 3.05 | 2.99 | 2.84 |
| 10Yr US and Indian bond Spread (bps) | 487 | 466 | 473 | 480 | 431 | 480 |
| AAA Indian Corporate | 7.63 | 8.70 | 8.67 | 8.78 | 8.76 | 8.69 |
| AA Indian Corporate | 7.96 | - | - | - | - | - |
| AAA to10YR Indian bond spread (bps) | 42 | 86 | 86 | 93 | 99 | 105 |
| Credit/Deposit Ratio | 73.41 | - | 77.05 | - | 77.30 | - |
| USD LIBOR | 1.69 | 2.61 | 2.64 | 2.64 | 2.69 | 2.77 |
Source: RBI, Investing.com
| Deposit (In Rs. Lakh cr) | Bank Credit (In Rs. Lakh cr) | |
| As on Nov 09, 2018 | 118.13 | 91.32 |
| As on Nov 06, 2018 | 118.25 | 91.11 |
| As on Nov 10, 2017 | 108.35 | 79.31 |
| YTD (% change) | -0.10% | 0.23% |
| YoY (% change) | 9.03% | 15.14% |
Source: RBI
| Commercial Paper (Fortnight): | Outstanding (In Rs. Lakh cr) | Amount issued (In Rs. Lakh cr) |
| 30-Nov-18 | 5.60 | 1.30 |
| 31-Oct-18 | 5.88 | 0.95 |
| 15-Nov-17 | 4.73 | 0.96 |
| % Change (MoM) | -4.76% | 36.84% |
| % Change (YoY) | 18.39% | 35.42% |
Source: RBI
Indices
| Indices | 17 Dec, 2017 | 16 Nov, 2018 | 23 Nov, 2018 | 30 Nov, 2018 | 07 Dec, 2018 |
| NSE Index | 10,530.70 | 10,682.20 | 10,526.75 | 10,876.75 | 10,693.70 |
| Index Return (%) | 2.97 | 0.92 | -1.46 | 3.32 | -1.68 |
| BSE Index | 34,056.83 | 35,457.16 | 34,981.02 | 36,194.30 | 35,673.25 |
| Index Return (%) | 8.74 | 0.85 | -1.34 | 3.47 | -1.44 |
Liquidity Operation by RBI:
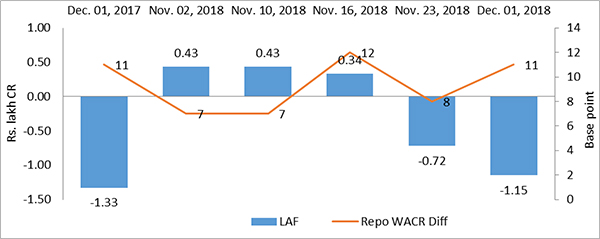
Source: RBI
Note: Net injection (+) and Net absorption (-)
Corporate Bond Position (in Rs. lakh cr):
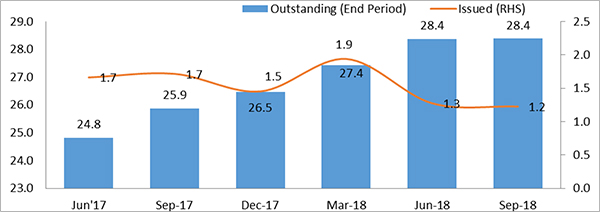
Source: RBI, Acuité Research
USD-INR Movement
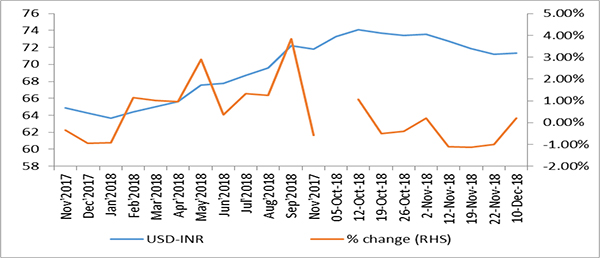
Source: RBI, Acuité Research
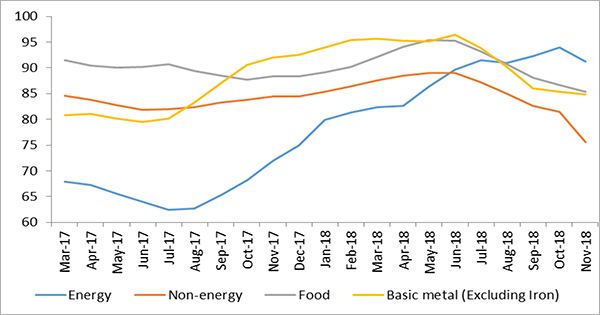
Commodity Price Movement (3 Month Moving Average):
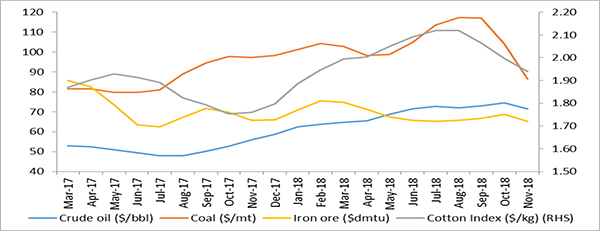
Commodity Price Index (3 Month Moving Average):
Birabrata Panda
Statistician
 +91 99698 98000
 info@acuite.in
 Follow us
 +91 22 49294000
 DOWNLOAD