Key Takeaways:
Liquidity:
Domestic money market continued to experience liquidity pressures in October, ending first week. With a 12.5% growth, credit offtake has been expanding at a solid pace. Deposit, on the other hand,has been growing at just 8%. As a result, credit to deposit (CD) ratio reached 76.13%, which is highest since April, 2016. Higher CD ratio indicates that the commercial bank lending vis-à-vis their deposit, is rising.
On the other hand, the Repo-WACR differential has improved to 16 bps in second week of October, 2018 as RBI infused Rs. 200 billion into the system through Open Market Operations (OMO) during late September. It is noted that the liquidity condition in the banking system has worsened with the fall in Repo-WACR differential to a negative territory in the 3rd week of September.
Capital Market:
Capital market continues to be less attractive for the domestic investors as both the Government and corporate bond yields remain unattractively high. The spread between 10-year Indian G-Sec bond and 10-year US bond remains at a higher level of 487 bps. On account of higher yield, commercial bond issuances have dropped by (-) 28% in September, 2018 on a MoM basis.
Currency Trend:
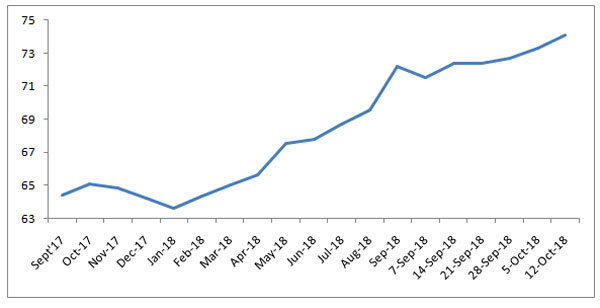
With the volatility in the global financial market, Indian rupee continues to remain weak. Currently,the USD-INR pair has been trading at an all-time high of Rs. 74.07. The pair is expected to hover around Rs. 73.75 in October, besides the net FPI inflows remains negative. Moreover, volatility in the forex market is likely to be high as the 7thUS Federal Open Market Committee(FOMC) meeting (due on 7-8th November, 2018) is around the corner.
Weekly Interest Rate and Ratios Update
| Oct. 06, 17 | Sep. 07, 18 | Sep. 14, 18 | Sep. 21, 18 | Sep. 28, 18 | Oct. 05, 18 | |
| Policy Repo Rate | 6.00 | 6.50 | 6.50 | 6.50 | 6.50 | 6.50 |
| Call Money Rate (WA) | 5.84 | 6.32 | 6.46 | 6.57 | 6.49 | 6.34 |
| 364-Day Treasury Bill Yield | 6.20 | 7.52 | 7.68 | 7.66 | 7.73 | 7.77 |
| 2-Yr Indian G-Sec | 6.44 | 8.00 | 7.99 | 7.83 | 7.76 | 7.79 |
| 10-Yr Indian G-Sec | 6.92 | 7.98 | 8.07 | 8.03 | 8.00 | 8.02 |
| 10-Yr US G-Sec | 2.36 | 2.99 | 3.07 | 3.07 | 3.23 | 3.15 |
| 10Yr India Spread | 4.56 | 4.99 | 5.00 | 4.96 | 4.77 | 4.87 |
| AAA Indian Corporate | 7.50 | 8.96 | 8.86 | 8.89 | 8.85 | 9.00 |
| AA Indian Corporate | 7.96 | 9.73 | 9.63 | 9.82 | 9.74 | 9.74 |
| AAA to10 YR Indian bond spread | 0.58 | 0.98 | 0.79 | 0.86 | 0.85 | 0.98 |
| Credit/Deposit Ratio | - | - | 76.08 | - | 76.13 | - |
| USD LIBOR | 1.38 | 2.31 | - | 2.39 | 2.40 |
Commercial Banking Update:
| Deposit (In Rs. Lakh cr) | Bank Credit (In Rs. Lakh cr) | |
| As on Sep 28, 2018 | 117.99 | 89.82 |
| As on May 11, 2018 | 113.43 |
85.21 |
| As on Sep 29, 2017 | 109.18 | 79.83 |
| YTD (% change) | 4.02% | 5.42% |
| YoY (% change) | 8.08% | 12.51% |
Weekly Money Market Update:
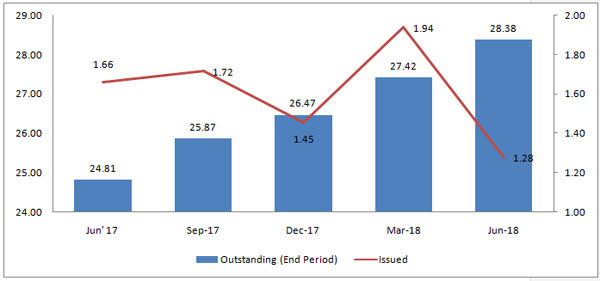
Commercial Paper (Fortnight): |
Outstanding (In Rs. Lakh Cr) |
>Amount issued (In Rs. Lakh Cr) |
| 30-Sep-18 | 5.56 | 1.12 |
| 31-Aug-18 | 6.32 | 1.60 |
|
30-Sep-17 |
3.93 | 1.16 |
|
% Change (MoM) |
-12.04% | -27.93% |
|
% Change (YoY) |
41.45% | -3.24% |
Source: RBI
Changes in Corporate Bond Position (in Rs. lakh cr):
Source: RBI, Acuité Research
Liquidity Operation by RBI:
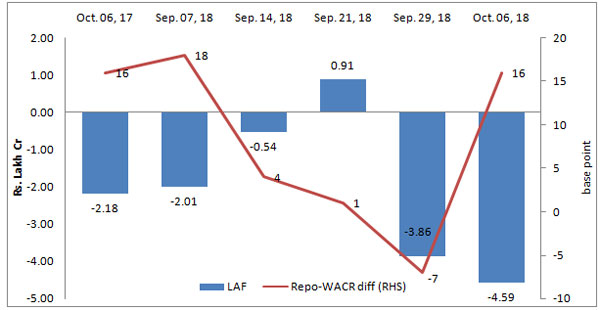
Source: RBI
Note: Net injection (+) and Net absorption (-)
USD-INR Movement (65.08 in Sept, 2017 to 72.22 in Sept, 2018)
Source: RBI, Acuité Research
 +91 99698 98000
 info@acuite.in
 Follow us
 +91 22 49294000
 DOWNLOAD