Key Highlights:
Liquidity
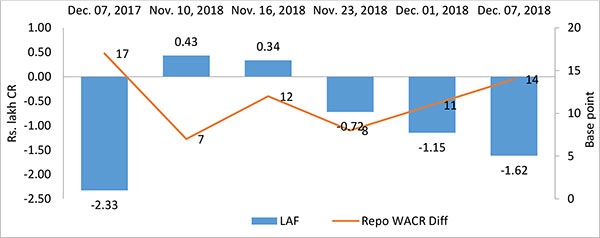
Liquidity condition in the domestic market seems to have stabilized positively. The spread between Repo and WACR reached 14 bps in first week of December, 2018. This indicates rising liquidity in the system and a return to pre September situation. Liquidity has been at ex-ante surplus in recent weeks - a phenomenon which is a result of recent interventions by RBI through OMO operations. Credit deposit ratio on the other hand stands at an all-time high of 77.30. Both credit and deposits are growing at a healthy rate of 15.1 and 9.4%, respectively. However, one must consider that whenever credit offtake outpaces growth in deposits, deposit rates are expected to rise in the short to medium term.
Capital Market:
Global bond market witnessed a downward trend in sovereign bond yields. Recent macro numbers for various major countries indicate a mild global demand. Therefore, investors are concerned about a looming slowdown in economic outlook. US yields are also somewhat stable given Fed Governor’s market calming speech, which extends the argument of a delayed normalization.
In domestic market, both global and domestic factors are collectively driving down the 10-year Indian G-Sec yield curve. It is known that the sovereign bond yield is on downward roll over the past 10 weeks. The spread between 10-year Indian G-Sec bond yield and 364 T bills rates has come down to 26 bps in the first week of December; to get things in perspective, the spread was above 100 bps a year earlier. We note that a lower spread between short term and long term bond yields will adversely impact the profitability of banks.
Currency Trend:
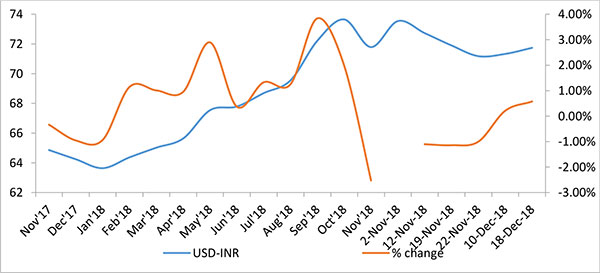
The USD-INR currency pair has been quite volatile on account of political risk in second week of December. However, the Indian rupee is recovering quickly. Currently the currency pair is trading at 70.45 as against a weekly average of 71.74 in the previous week. With favourable macro variables, arrested US normalization and stabilizing capital inflows, the domestic currency is expected to remain firm against the US dollar.
| Interest Rate | Dec.08, 2017 | Nov.10, 2018 | Nov.16, 2018 | Nov.23, 2018 | Nov.30, 2018 | Dec.07, 2018 |
| Policy Repo Rate | 6.00 | 6.50 | 6.50 | 6.50 | 6.50 | 6.50 |
| Call Money Rate (WA) | 5.83 | 6.43 | 6.38 | 6.42 | 6.39 | 6.36 |
| 364-Day Treasury Bill Yield | 6.25 | 7.42 | 7.33 | 7.27 | 7.22 | 7.15 |
| 2-Yr Indian G-Sec | 7.26 | 7.42 | 7.35 | 7.30 | 7.24 | 7.18 |
| 10-Yr Indian G-Sec | 7.27 | 7.81 | 7.85 | 7.77 | 7.64 | 7.41 |
| 10-Yr US G-Sec | 2.37 | 3.08 | 3.05 | 2.99 | 2.84 | 2.89 |
| 10Yr India-US Spread | 490.00 | 473.00 | 480.00 | 431.00 | 480.00 | 452.00 |
| AAA Indian Corporate | 7.77 | 8.67 | 8.78 | 8.76 | 8.69 | 8.63 |
| AA Indian Corporate | 8.00 | - | - | - | - | - |
| AAA to10 YR Indian bond spread | 50.00 | 86.00 | 93.00 | 99.00 | 105.00 | 122.00 |
| Credit/Deposit Ratio | 73.63 | 77.05 | - | 77.30 | - | - |
| USD LIBOR | 2.75 | 2.64 | 2.64 | 2.69 | 2.77 | 2.80 |
Source: RBI, Investing.com
Interest rates and ratio
| Deposit (In Rs. Lakh cr) | Bank Credit (In Rs. Lakh cr) | |
| As on Nov 23, 2018 | 118.14 | 91.32 |
| As on Nov 09, 2018 | 118.26 | 91.11 |
| As on Nov 23, 2017 | 107.95 | 79.35 |
| YTD (% change) | -0.10% | 0.23% |
| YoY (% change) | 9.44% | 15.09% |
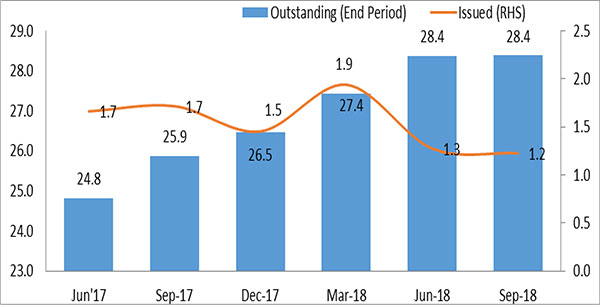
| Commercial Paper (Fortnight): | Outstanding (In Rs. Lakh cr) | Amount issued (In Rs. Lakh cr) |
| 30-Nov-18 | 5.60 | 1.30 |
| 31-Oct-18 | 5.88 | 0.95 |
| 15-Nov-17 | 4.73 | 0.96 |
| % Change (MoM) | -0.05 | 0.37 |
| % Change (YoY) | 0.18 | 0.35 |
Source: RBI
| Indices | 14 Dec, 2017 | 23 Nov, 2018 | 30 Nov, 2018 | 07 Dec, 2018 | 14 Dec, 2018 |
| NSE Index | 10,530.70 | 10,526.75 | 10,876.75 | 10,693.70 | 10,805.45 |
| NSE Index Return | 2.97 | -1.46 | 3.32 | -1.68 | 1.05 |
| BSE Index | 34,056.83 | 34,981.02 | 36,194.30 | 35,673.25 | 35,962.93 |
| BSE Index Return | 2.74 | -1.34 | 3.47 | -1.44 | 0.81 |
Liquidity Operation by RBI:
 Source: RBI
Note: Net injection (+) and Net absorption (-)
Corporate Bond Position (in Rs. lakh cr):
 Source: RBI, Acuité Research
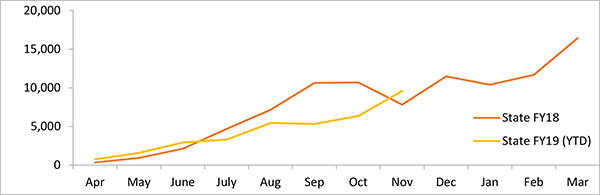
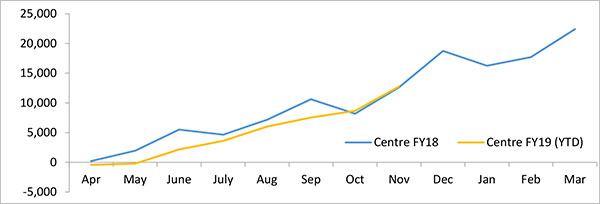
Market Borrowings of Central and State Governments (in Rs. Billion)
USD-INR Movement
 Source: RBI, Acuité Research
 +91 99698 98000
 info@acuite.in
 Follow us
 +91 22 49294000
 DOWNLOAD