Key Highlights:
Liquidity
Liquidity condition remains stable at comfortable zone as Repo-WACR differential stands at 15 bps. There is a net absorption of Rs. 20.5 lakh crores. However, RBI had also infused 100 billion through OMO operation to maintain the sufficient liquidity in the system. Growth in deposit has increased by 70 bps to 9.92% in first week of January. Credit offtake, on the other hand, has softened by almost 60 bps to 14.54% during the said period. As a result, Credit-Deposit ratio has also reverse to 77.6 after reaching a peak of 78.6 a fort night earlier.
Capital Market:
The 10-year US G-Sec yield remains stable at 2.69. 10-year Indian G-Sec yield, on the other hand, has dropped by 18 bps to 7.27%. As a result, the spread between the two bond yields remains at a low level of 458 bps. A positive development in US-China trade negotiation is primarily encouraging the investors to stepping out for investing in Emerging Markets.
Currency Trend:
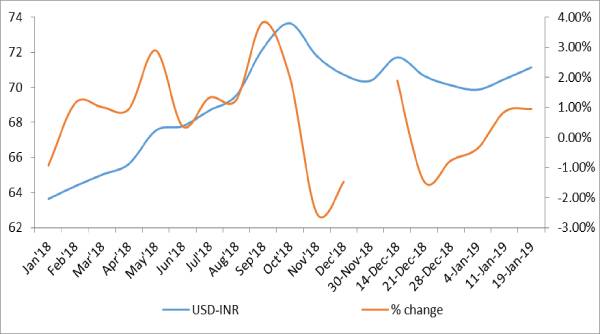
The global currency market remains less volatile under the uncertainty of Brexit deal. Moreover, less volatility in currency market is also attributed to stability in commodity price and financial market. In third week of January, Indian rupee appreciated by nearly eight bps.
Interest rates and ratio
|
Interest Rate |
Jan.12, 2018 |
Dec.14, 2018 |
Dec.21, 2018 |
Dec.28, 2018 |
Jan.04, 2019 |
Jan.11, 2019 |
|
Policy Repo Rate |
6.00 |
6.5 |
6.5 |
6.50 |
6.50 |
6.50 |
|
Call Money Rate (WA) |
5.88 |
6.44 |
6.49 |
6.57 |
6.35 |
6.35 |
|
364-Day Treasury Bill Yield |
6.53 |
7.04 |
6.97 |
6.42 |
6.91 |
6.88 |
|
2-Yr Indian G-Sec |
6.86 |
7.05 |
7.04 |
7.08 |
6.99 |
7.00 |
|
10-Yr Indian G-Sec |
7.26 |
7.41 |
7.26 |
7.41 |
7.45 |
7.27 |
|
10-Yr US G-Sec |
2.46 |
2.78 |
2.71 |
2.64 |
2.69 |
2.69 |
|
Spread in bps (10Yr Indian-10Yr US) |
480 |
463 |
455 |
477 |
476 |
458 |
|
AAA Indian Corporate |
7.93 |
8.63 |
8.65 |
8.48 |
8.57 |
8.55 |
|
AA Indian Corporate |
8.51 |
- |
- |
9.35 |
8.93 |
8.48 |
|
Spread AAA to10 YR Indian bond |
67 |
85 |
139 |
107 |
112 |
128 |
|
Credit/Deposit Ratio |
74.24 |
- |
78.59 |
- |
77.60 |
- |
|
USD LIBOR |
1.69 |
2.82 |
2.82 |
2.75 |
2.80 |
2.78 |
Source: RBI, Investing.com
|
|
Deposit (In Rs. Lakh cr) |
Bank Credit (In Rs. Lakh cr) |
|
As on Jan 04, 2019 |
120.34 |
93.38 |
|
As on Jan 21, 2018 |
118.16 |
92.88 |
|
As on Jan 05, 2018 |
109.49 |
81.53 |
|
YTD (% change) |
1.84% |
0.55% |
|
YoY (% change) |
9.91% |
14.54% |
Source: RBI
|
Commercial Paper (Fortnight): |
Outstanding (In Rs. Lakh cr) |
Amount issued (In Rs. Lakh cr) |
|
31-Dec-18 |
4.99 |
0.96 |
|
30-Nov-18 |
5.61 |
1.30 |
|
31-Dec-17 |
4.09 |
0.92 |
|
% Change (MoM) |
-11.04% |
-26.36% |
|
% Change (YoY) |
21.92% |
4.56% |
Source: RBI
Indices
|
|
11-Jan-18 |
28-Dec-18 |
04-Jan-2019 |
11-Jan-19 |
18-Jan-19 |
|
NSE Index |
11,027.70 |
10,859.90 |
10,727.35 |
10,794.95 |
10,906.95 |
|
NSE Index Return |
4.72 |
0.74 |
0.52 |
-0.25 |
0.02 |
|
BSE Index |
35,965.02 |
36,076.7 |
35,695.10 |
36,009.84 |
36,386.61 |
|
BSE Index Return |
5.6 |
0.94 |
0.51 |
-0.27 |
0.03 |
Liquidity Operation by RBI:
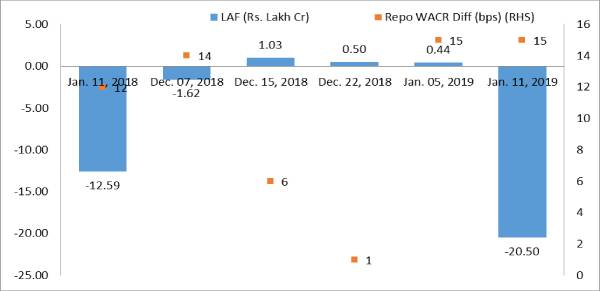 Source: RBI
Note: Net injection (+) and Net absorption (-)
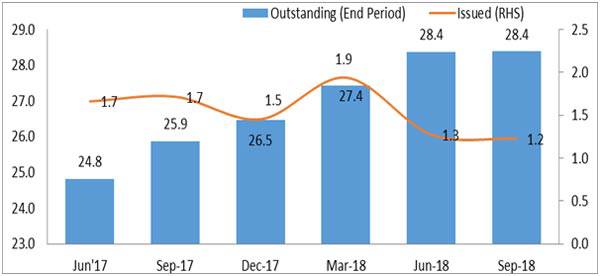
Corporate Bond Position (in Rs. lakh cr):
 Source: RBI, Acuité Research
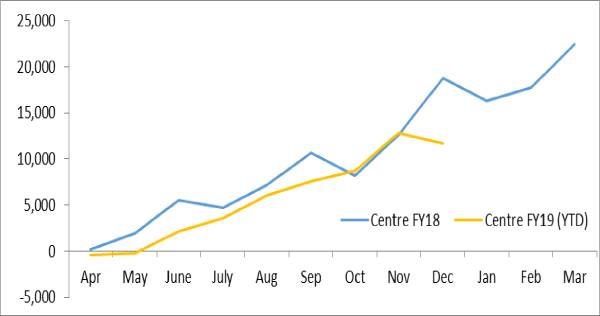
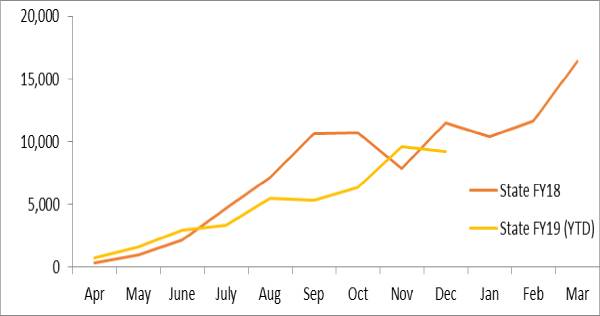
Net Debt Issuance by Centre and State Government:
 Source: Acuité Research, RBI
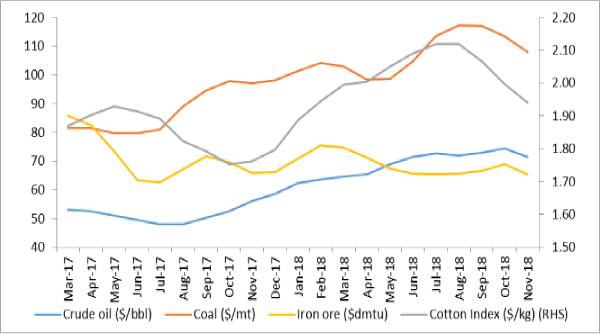
Commodity Price Movement (3 Month Moving Average):
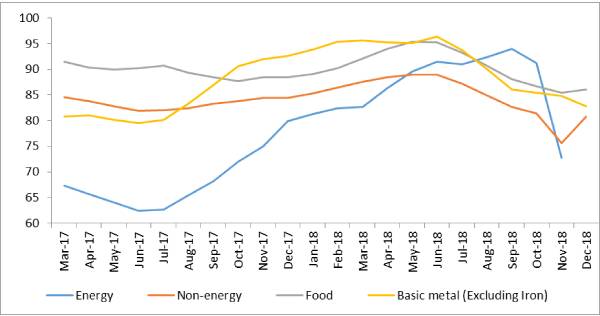
Commodity Price Index (3 Month Moving Average):
USD-INR Movement
 Source: RBI, Acuité Research
 +91 99698 98000
 info@acuite.in
 Follow us
 +91 22 49294000
 DOWNLOAD