Key Takeaways:
Liquidity:
Domestic money market continued to experience liquidity pressures in October as Repo WACR differential stands at 9 bps. Credit offtake has been expanding at a solid pace of 12.5% in October.It is noted that the liquidity condition in the banking system has worsened with the fall in Repo-WACR differential to a negative territory in the 3rd week of September. However, with the infusion of Rs. 200 billion by RBI through OMO operation, the liquidity condition in the banking sector had marginally improved during late September.
Capital Market:
There is a marginal improvement in the capital as spread between 10-year Indian G-Sec bond and 10-year US bond has improved by 10 bps to 477 bps in second week of October. Therefore, the market for Indian debt has become more attractive (for foreign portfolio managers) as compared to the previous year when the spread was only 464 bps. On account of higher yield, commercial bond issuances have dropped by (-) 27.9% in September, 2018 on a MoM basis.
Currency Trend:
With the volatility in the global financial market, Indian rupee continues to remain weak. Currently, the USD-INR pair has been trading at an all-time high ofRs. 73.51. The pair is expected to hover around Rs. 73.75 in October, besides the net FPI inflows remains negative. Improvement in trade balance and strong NRI deposits are giving positive sentiment for the forex market. Moreover, volatility in the forex market is likely to be high as the 7th US Federal Open Market Committee (FOMC) meeting (due on 7-8th November, 2018) is around the corner.
Interest Rate and Ratio
| Oct. 13, 2017 | Sep. 14, 2018 | Sep. 21, 2018 | Sep. 28, 2018 | Oct. 05, 2018 | Oct. 12, 2018 | |
| Policy Repo Rate | 6.00 | 6.50 | 6.50 | 6.50 | 6.50 | 6.50 |
| Call Money Rate (WA) | 5.86 | 6.46 | 6.57 | 6.49 | 6.34 | 6.41 |
| 364-Day Treasury Bill Yield | 6.22 | 7.68 | 7.66 | 7.73 | 7.77 | 7.58 |
| 2-Yr Indian G-Sec | 6.41 | 7.99 | 7.83 | 7.76 | 7.79 | 7.65 |
| 10-Yr Indian G-Sec | 6.91 | 8.07 | 8.03 | 8.00 | 8.02 | 7.96 |
| 10-Yr US G-Sec | 2.27 | 3.07 | 3.07 | 3.23 | 3.15 | 3.19 |
| 10Yr India Spread | 4.64 | 5.00 | 4.96 | 4.77 | 4.87 | 4.77 |
| AAA Indian Corporate | 7.50 | 8.86 | 8.89 | 8.85 | 9.00 | 8.31 |
| AA Indian Corporate | 7.95 | 9.63 | 9.82 | 9.74 | 9.74 | 9.49 |
| AAA to10 YR Indian bond spread | 0.59 | 0.79 | 0.86 | 0.85 | 0.98 | 0.35 |
| Credit/Deposit Ratio | 72.54 | 76.08 | - | 76.13 | - | - |
| USD LIBOR (3 Month) | 1.384 | - | 2.315 | 2.39 | 2.408 | 2.428 |
| Deposit (In Rs. Lakh cr) | Bank Credit (In Rs. Lakh cr) | |
| As on Sep 28, 2018 | 117.99 | 89.82 |
| As on May 11, 2018 | 113.43 | 85.21 |
| As on Sep 29, 2017 | 109.18 | 79.83 |
| YTD (% change) | 4.02% | 5.42% |
| YoY (% change) | 8.08% | 12.51% |
Source: RBI
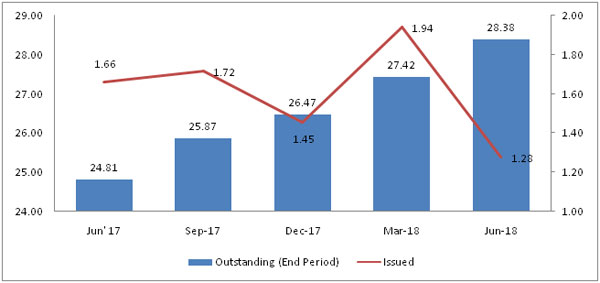
Bond Market:
Commercial Paper (Fortnight): |
Outstanding (In Rs. Lakh cr) | Amount issued (In Rs. Lakh cr) |
| 30-Sep-18 | 5.56 | 1.12 |
| 31-Aug-18 | 6.32 | 1.60 |
| 30-Sep-17 | 3.93 | 1.16 |
| % Change (MoM) | -12.04% | -27.93% |
| % Change (YoY) | 41.45% | -3.24% |
Source: RBI
Changes in Corporate Bond Position (in Rs. lakh cr):
Source: RBI, Acuité Research
Liquidity Operation by RBI:
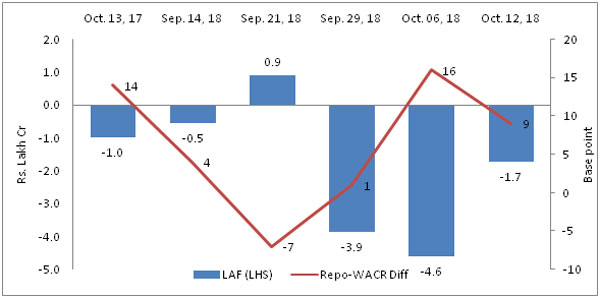
Source: RBI
Note: Net injection (+) and Net absorption (-)
USD-INR Movement (65.08 in Sept, 2017 to 72.22 in Sept, 2018)
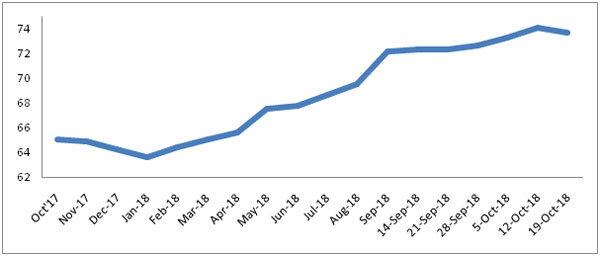
Source: RBI, Acuité Research
Sector wise Credit Offtake (YoY Growth)
| Aug-17 | Apr-18 | May-18 | Jun-18 | Jul-18 | Aug-18 | |
| Overall Offtake | 5.5 | 10.68 | 11.13 | 11.1 | 10.55 | 12.42 |
| Agriculture and allied activities | 6.54 | 5.87 | 6.44 | 6.55 | 6.59 | 6.57 |
| Industry | -0.27 | 1.01 | 1.45 | 0.89 | 0.35 | 1.95 |
| Micro & small | 0.79 | 0.3 | 0.23 | 0.71 | 0.02 | 2.6 |
| Medium | -8.35 | 3.64 | 4.07 | 2.69 | 2.93 | 6.47 |
| Large | -0.04 | 1.01 | 1.53 | 0.83 | 0.28 | 1.63 |
| Services | 5.01 | 20.72 | 21.95 | 23.33 | 23.04 | 26.66 |
| Transport operators | 4.54 | 11.58 | 11.33 | 11.02 | 12.32 | 13.93 |
| Computer software | -3.83 | 2.53 | 5.91 | 8.48 | 4.09 | 4.25 |
| Tourism, hotels & restaurants | -5.64 | 3.12 | 3.26 | 1.4 | 0.6 | 1.89 |
| Shipping | -28.6 | -13.71 | -11.73 | -11.52 | -7.1 | -5.11 |
| Professional services | 13.85 | 14.06 | 19.34 | 20.18 | 17.11 | 23.53 |
| Trade | 4.69 | 13.65 | 15.49 | 15.24 | 13.97 | 15.98 |
| Commercial real estate | -3.05 | 1.57 | 3.29 | 5.24 | 2.43 | 6.29 |
| NBFCs | 0.28 | 29.49 | 29.98 | 35.37 | 40.28 | 43.95 |
| Personal loans | 15.73 | 19.09 | 18.6 | 17.89 | 16.74 | 18.21 |
| Consumer durables | -9.77 | -4.35 | 17.05 | 17.26 | 18.91 | -81.45 |
| Housing | 13.18 | 14.88 | 15.5 | 15.83 | 16.52 | 16.99 |
| Credit card outstanding | 32.59 | 35.18 | 33.11 | 31.31 | 30.83 | 37.37 |
| Education | 0.78 | -1.37 | -0.8 | -1.27 | -1.72 | -1.22 |
| Vehicle loans | 9.15 | 9.94 | 10.41 | 11.09 | 11.17 | 12.68 |
| Other personal loans | 31.3 | 35.54 | 32.18 | 27.52 | 21.32 | 29.15 |
Industry wise Credit Offtake (YoY Growth):
Sector |
Aug-17 | Apr-18 | May-18 | Jun-18 | Jul-18 | Aug-18 |
| Overall Industry | -0.27 | 1.01 | 1.45 | 0.89 | 0.35 | 1.95 |
| Mining and quarrying | -6.27 | 6.35 | 22.51 | 22.2 | 24.61 | 30.12 |
| Food processing | 0.04 | 5.63 | 5.21 | 3.29 | 1.39 | 1.79 |
| Beverages and tobacco | 4.49 | -12.54 | -7.65 | -15.66 | -22.14 | -22.88 |
| Textiles | -0.73 | 5.08 | 5.57 | 5.5 | 4.25 | 2.51 |
| Leather and leather products | 2.38 | 8.33 | 6.31 | 4.83 | 5.15 | 5.39 |
| Wood and wood products | -1 | 7.34 | 9.79 | 9.63 | 10.06 | 9.53 |
| Paper and paper products | -8.04 | -7.14 | -6.59 | -4.47 | -5.01 | -3.83 |
| Energy | 0.9 | 16.02 | 19.73 | 21.84 | 5.87 | 10.78 |
| Chemical and chemical products | 2.74 | -1.75 | 4.22 | 2.26 | 4.91 | 7.67 |
| Rubber, plastic and their products | 5.99 | 10.62 | 10.65 | 6.88 | 7.61 | 10.99 |
| Glass and glassware | -6.25 | 9.2 | 15.02 | 18.04 | 28.63 | 25.89 |
| Cement and cement products | 1.39 | -2.34 | 5.74 | 2.72 | -4.82 | -5.47 |
| Basic metal and metal products | -0.15 | -0.88 | -3.64 | -5.51 | -8.34 | -7.81 |
| Engineering | -3.53 | 4.4 | 4.82 | 4.25 | 4.32 | 5.98 |
| Auto ancillary | 1.2 | 3.85 | 0.52 | 5.98 | 5.99 | 6.68 |
| Gems and Jewellery | 3.18 | -1.42 | 0.5 | -1.28 | 0.06 | -2.35 |
| Construction | 6.52 | 10.63 | 8.27 | 7.3 | 10.54 | 8.38 |
| Power | 0.18 | -0.76 | -1 | -1.21 | 0.41 | 1.59 |
| Telecommunication | -4.68 | 4.22 | 5.35 | 6.8 | 9.53 | 10.51 |
| Roads | -6.79 | -8.01 | -4.9 | -5.66 | -5.41 | -0.03 |
| Other industries | 2.45 | -1.1 | -2.41 | -4.96 | -11.04 | -3.42 |
Source: RBI, Acuité Research
 +91 99698 98000
 info@acuite.in
 Follow us
 +91 22 49294000
 DOWNLOAD