Key Highlights:
Liquidity
Market experienced liquidity pressure in 3rd week of December, 2018. The Repo WACR differential reached 6 bps; this was 14 bps a week earlier. Generally, liquidity condition remains tight during a quarter end due to quarterly GST payments to the government. In order to facilitate sufficient liquidity in the system, RBI has infused Rs. 100 billion through OMO operation over the last week. Moreover, the central bank is expected to infuse another Rs. 500 billion in January, 2019. Credit deposit ratio on the other hand further increased to 77.44. This is a result of faster credit offtake (15%) as compared to deposit growth (9.6%). The faster credit offtake is mounting pressure in domestic liquidity and it shows from these numbers that are in a flux.
Capital Market:
Domestic capital market more or less remains stable in 3rd week of December. The 10 years Indian G - Sec bond yield remains muted at 7.44% primarily because of healthy inflows in light of a dovish US Fed. However, increase in 10 year US bond yield (especially after the December hike) caused the spread to decline between the two sovereign bond yields - standing at 463 bps. The capital market is expected to remain volatile till the market finds a new equilibrium point in the post fed rate hike scenario. It is known that Fed has increased fed rate by 25 bps, with the new range being 2.0 - 2.50%.
Currency Trend:
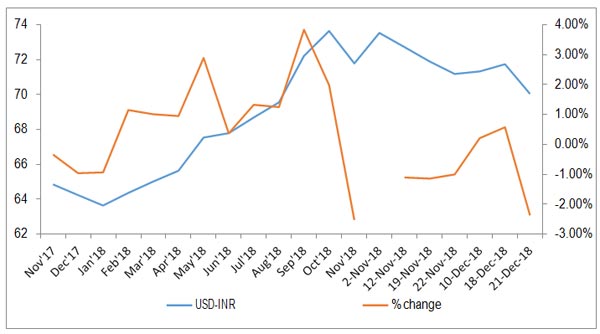
Indian rupee has appreciated sharply by 2.30% against USD last week. Indian rupee is gaining momentum due to favourable environment created by global commodity markets and a reluctant Federal Reserve. However, forthcoming weeks will be characterized by currency markets being highly highly volatile on account of changing monetary conditions across the world. We therefore remain vigilant of the Developed Market central banking eventual stance and perceived repercussions on Emerging Markets.
Interest rates and ratio
| Interest Rate | Dec.15, 2017 | Nov.16, 2018 | Nov.23, 2018 | Nov.30, 2018 | Dec.07, 2018 | Dec.14, 2018 |
| Policy Repo Rate | 6.00 | 6.50 | 6.50 | 6.50 | 6.50 | 6.50 |
| Call Money Rate (WA) | 5.86 | 6.38 | 6.42 | 6.39 | 6.36 | 6.44 |
| 364-Day Treasury Bill Yield | 6.36 | 7.33 | 7.27 | 7.22 | 7.15 | 7.04 |
| 2-Yr Indian G-Sec | 6.61 | 7.35 | 7.3 | 7.24 | 7.18 | 7.05 |
| 10-Yr Indian G-Sec | 7.29 | 7.85 | 7.77 | 7.64 | 7.41 | 7.41 |
| 10-Yr US G-Sec | 2.35 | 3.05 | 2.99 | 2.84 | 2.89 | 2.78 |
| Spread in bps (10Yr Indian-10Yr US) | 494 | 480 | 431 | 480 | 452 | 463 |
| AAA Indian Corporate | 7.63 | 8.78 | 8.76 | 8.69 | 8.63 | 8.63 |
| AA Indian Corporate | 7.97 | - | - | - | -- | - |
| Spread AAA to10 YR Indian bond | 68 | 93 | 99 | 105 | 122 | 85 |
| Credit/Deposit Ratio | 74.38 | - | 77.30 | - | 77.44 | - |
| USD LIBOR | 1.69 | 2.64 | 2.69 | 2.77 | 2.80 | 2.82 |
| Deposit (In Rs. Lakh cr) | Bank Credit (In Rs. Lakh cr) | |
| As on Dec 07, 2018 | 118.85 | 92.04 |
| As on Nov 23, 2018 | 118.14 | 91.33 |
| As on Dec 07, 2017 | 108.38 | 79.98 |
| YTD (% change) | 0.60% | 0.78% |
| YoY (% change) | 9.66% | 15.07% |
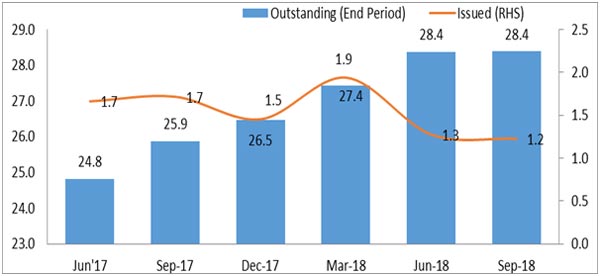
| Commercial Paper (Fortnight): | Outstanding (In Rs. Lakh cr) | Amount issued (In Rs. Lakh cr) |
| 15-Dec-18 | 5.46 | 1.04 |
| 30-Nov-18 | 5.61 | 1.30 |
| 15-Dec-17 | 4.82 | 0.96 |
| % Change (MoM) | -2.59% | -20.31% |
| % Change (YoY) | 13.41% | 7.76% |
Indices
| 24 Dec, 2017 | 30 Nov, 2018 | 07 Dec, 2018 | 14 Dec, 2018 | 21 Dec, 2018 | |
| NSE Index | 10,530.70 | 10,876.75 | 10,693.70 | 10,805.45 | 10,754.00 |
| NSE Index Return | 2.97 | 3.32 | -1.68 | 1.05 | -1.81 |
| BSE Index | 34,056.83 | 36,194.30 | 35,673.25 | 35,962.93 | 35,742.07 |
| BSE Index Return | 2.74 | 3.47 | -1.44 | 0.81 | -1.89 |
Liquidity Operation by RBI:
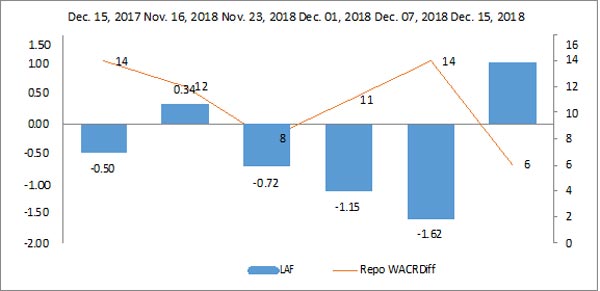 Source: RBI
Note: Net injection (+) and Net absorption (-)
Corporate Bond Position (in Rs. lakh cr):
 Source: RBI, Acuité Research
Commodity Price Movement (3 Month Moving Average):
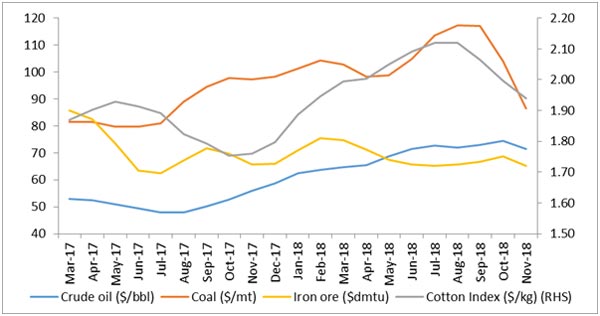
Commodity Price Index (3 Month Moving Average):
 +91 99698 98000
 info@acuite.in
 Follow us
 +91 22 49294000
 DOWNLOAD