Key Takeaways:
Liquidity:
Liquidity condition has enhanced significantly in third week of November, 2018. The repo WACR differential dropped to 12 bps indicates sufficient liquidity in the market. RBI has infused Rs. 320 billion through OMO in November only. Credit (14.9%) is growing much faster than deposit (9.1%). As a result of this, credit to deposit ratio has reached 77.05, which is highest in last three year. This has squeezed the liquidity condition in the banking system.
Capital Market:
With the Federal Reserve’s pose the fed rate hike cycle, net capital inflows to emerging markets turned positive. As a result, Indian sovereign bond yield has stabilized at 7.8% for past few weeks. However, fall in 10 year US bond yield has increased the spread between 10 year Indian G-Sec and US G-Sec bond yield.
Currency Trend:
Indian rupee, on upward roll for last few weeks, has reached two month high of 71.47 in third week of November, 2018.It is known that value of Indian rupee had dropped to an all-time low of 74.07 in in October, 2018. Oil price, a major factor in driving the value of Indian rupee, is trading at twelve month low. The trend in capital inflows and oil price indicate that upward movement in rupee is expected to continue in next month as well. The volatility in the currency pair seems to be weakened. Stability in exchange rate will benefit the domestic entities who are involved in foreign trade.
Interest rates and ratio
| Interest Rate | Nov.17, 2017 | Oct. 19, 2018 | Oct. 26, 2018 | Nov.02, 2018 | Nov.10, 2018 | Nov.16, 2018 |
| Policy Repo Rate | 6.00 | 6.50 | 6.50 | 6.50 | 6.50 | 6.50 |
| Call Money Rate (WA) | 5.86 | 6.53 | 6.50 | 6.43 | 6.43 | 6.38 |
| 364-Day Treasury Bill Yield | 6.29 | 7.50 | 7.47 | 7.48 | 7.42 | 7.33 |
| 2-Yr Indian G-Sec | 6.62 | 7.58 | 7.44 | 7.43 | 7.42 | 7.35 |
| 10-Yr Indian G-Sec | 7.22 | 7.88 | 7.84 | 7.84 | 7.81 | 7.85 |
| 10-Yr US G-Sec | 2.34 | 3.07 | 3.20 | 3.18 | 3.08 | 3.05 |
| 10Yr Indian bond Spread (in bps) | 488 | 481 | 464 | 466 | 473 | 480 |
| AAA Indian Corporate | 7.63 | 8.63 | 8.89 | 8.70 | 8.67 | 8.78 |
| AA Indian Corporate | 7.97 | 8.97 | 8.97 | NA | NA | NA |
| AAA to10 YR Indian bond spread | 41 | 75 | 105 | 86 | 86 | 93 |
| Credit/Deposit Ratio | - | 76.75- | 76.75 | 76.75 | 77.05 | - |
| USD LIBOR | 2.58 | 2.47 | 2.58 | 2.61 | 2.64 | 2.69 |
Source: RBI, Investing.com
| Deposit (In Rs. Lakh cr) | Bank Credit (In Rs. Lakh cr) | |
| As on Nov 09, 2018 | 118.25 | 91.11 |
| As on Oct 26, 2018 | 117.71 | 90.33 |
| As on Nov 10, 2017 | 108.35 | 79.31 |
| YTD (% change) | 0.46% | 0.86% |
| YoY (% change) | 9.14% | 14.88% |
Source: RBI
Bond Market:
| Commercial Paper (Fortnight): | Outstanding (In Rs. Lakh cr) | Amount issued (In Rs. Lakh cr) |
| 15-Nov-18 | 5.85 | 1.07 |
| 31-Oct-18 | 5.88 | 0.95 |
| 15-Nov-17 | 4.82 | 1.03 |
| % Change (MoM) | -0.62% | 12.63% |
| % Change (YoY) | 21.37% | 3.88% |
Source: RBI
Liquidity Operation by RBI:
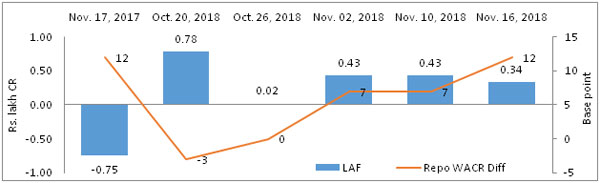
Source: RBI
Note: Net injection (+) and Net absorption (-)
Corporate Bond Position (in Rs. lakh cr):
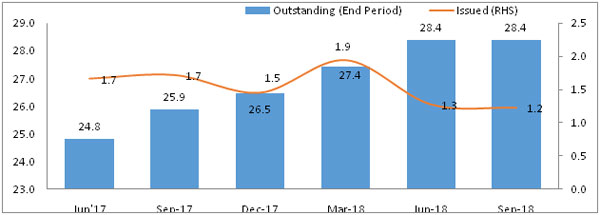
Source: RBI, Acuité Research
USD-INR Movement :
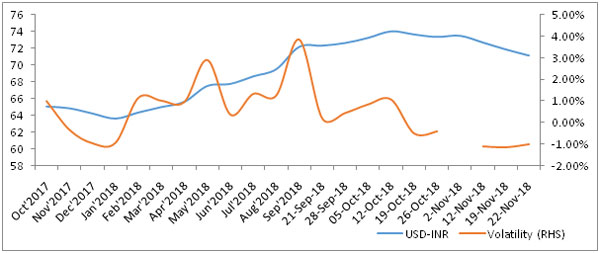
Source: RBI, Acuité Research
 +91 99698 98000
 info@acuite.in
 Follow us
 +91 22 49294000
 DOWNLOAD