Key Highlights:
Liquidity:
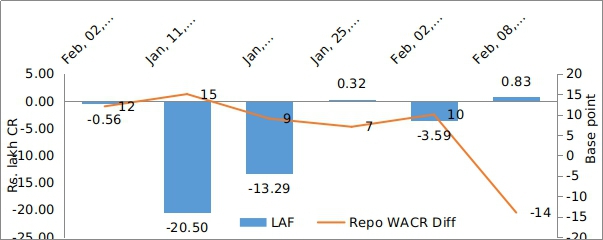
Liquidity condition has worsened in post rate cut scenario. The WACR stands at 6.39 as against repo rate of 6.25 during first week of February, 2019. However, we believe that the overnight lending rate will adjust to the new benchmark rate in a week’s time. In a positive development, the currency in circulation (CiC) ratio to M3 money supply has dropped by 14 bps to 13.32. Lower CiC in the system also indicating improvement of liquidity conditions in the domestic market as this translates into higher lending ability of commercial banks.
Capital Market:
The Indian 10-yr GSec yield seems to be stable for past four weeks. The benchmark bond yield is hovering at 7.35% for past four weeks. Though the fiscal slippage put upward pressure on the bond yield, the RBI’s infusion through OMO operation is preventing such moves. In the global market, with the developments in US-China trade agreement, the 10-yr US GSec bond yield remains more or less stable.
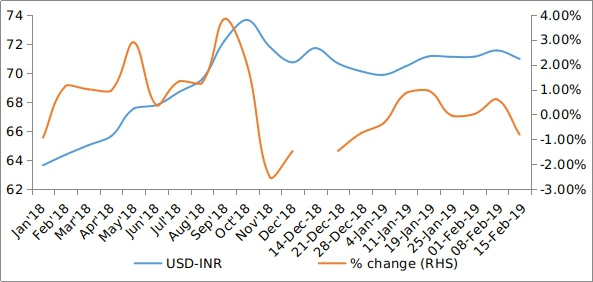
Currency Trend:
The US CPI inflation number for January has dropped by 30bps to 1.6%. The CPI print is 20 bps less than the lower side of Fed’s medium term target range (1.8 – 2.1%). This gives confidence to investors, who may expect a much awaited pause in Fed’s tightening monetary policy. Therefore, with a higher net capital inflow, the EM currencies are appreciating against the US dollar. The Indian rupee has also appreciated by 0.8% and stands at 70.97 per USD. However, we believe that with the global economic uncertainty and recovery in crude price, Indian rupee is expected to remain weak in the short term.
Interest rates and ratio:
| Interest Rate | Feb.,09
2018 |
Jan.11,
2019 |
Jan.,21
2019 |
Jan.,25
2019 |
Feb.,01
2019 |
Feb.,08
2019 |
| Policy Repo Rate | 6.00 | 6.50 | 6.50 | 6.50 | 6.50 | 6.25 |
| Call Money Rate (WA) | 5.88 | 6.35 | 6.41 | 6.43 | 6.40 | 6.39 |
| 364-Day Treasury Bill Yield | 6.58 | 6.88 | 6.83 | 6.82 | 6.78 | 6.78 |
| 2-Yr Indian G-Sec | 6.81 | 7.00 | 6.99 | 7.02 | 6.80 | 6.75 |
| 10-Yr Indian G-Sec | 7.54 | 7.27 | 7.32 | 7.35 | 7.38 | 7.34 |
| 10-Yr US G-Sec | 2.82 | 2.69 | 2.74 | 2.68 | 2.63 | 2.66 |
| Spread in bps (10Yr Indian-10Yr US) | 472 | 458 | 458 | 467 | 475 | 468 |
| AAA Indian Corporate | 8.03 | 8.55 | 8.55 | 8.62 | 8.67 | 8.70 |
| AA Indian Corporate | 8.81 | 8.48 | - | - | - | - |
| Spread AAA to10 YR Indian bond | 49 | 128 | 123 | 127 | 129 | 136 |
| Credit/Deposit Ratio | - | - | 77.85 | - | 77.79 | - |
| USD LIBOR | 2.78 | 2.77 | 2.75 |
Source: RBI, Investing.com
Acuité Portfolio Debt Instrument Benchmark Estimates (as on 18 Feb 2019):
| Category | 10-Yr Corporate Yield to Maturity |
| AAA* | 8.32% |
| AA+ | 8.39% |
| AA | 8.85% |
Source: Acuité Research; # Discount Factor: 0.0625; *Outside Benchmark
| Deposit (In Rs. Lakh cr) | Bank Credit (In Rs. Lakh cr) | |
| As on Feb 01, 2019 | 1,21,227.6 | 94,298.5 |
| As on Jan 18, 2018 | 1,19,859.8 | 93,325.6 |
| As on Feb 02, 2018 | 1,10,575.9 | 82,334.7 |
| YTD (% change) | 1.14% | 1.04% |
| YoY (% change) | 9.63% | 14.53% |
Source: RBI
Money Market Performance
| Commercial Paper (Fortnight): | Outstanding (In Rs. Lakh cr) | Amount issued (In Rs. Lakh cr) |
| 31-Jan-2019 | 5.54 | 1.01 |
| 15-Jan-2018 | 4.99 | 0.96 |
| 15-Jan-2018 | 4.58 | 1.32 |
| % Change (MoM) | 11.09% | 5.44% |
| % Change (YoY) | 21.10% | -23.50% |
Source: RBI
Indices
| 16-Feb-18 | 25-Jan-19 | 02-Feb-19 | 08-Feb-19 | 15-Feb-19 | |
| NSE Index | 10,452.30 | 10,780.55 | 10,893.65 | 10,943.60 | 10,724.40 |
| NSE Index Return | -0.03 | -0.64 | 0.58 | -1.14 | -0.2 |
| BSE Index | 34,010.76 | 36,025.54 | 36,469.43 | 36,546.48 | 35,808.95 |
| BSE Index Return | 0.01 | -0.47 | 0.59 | -1.15 | -0.19 |
Liquidity Operation by RBI:
 Source: RBI
Note: Net injection (+) and Net absorption (-)
Net Debt Issuance by Centre and State Government:
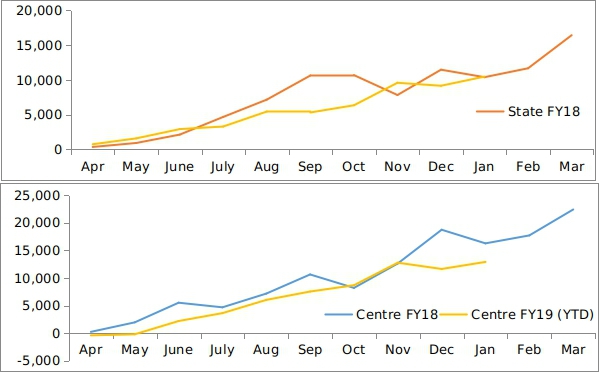 Source: Acuité Research, RBI
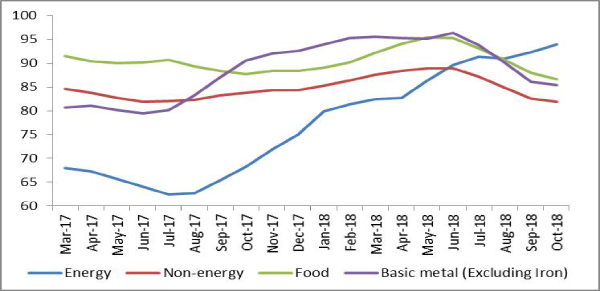
Commodity Price Index (3 Month Moving Average):
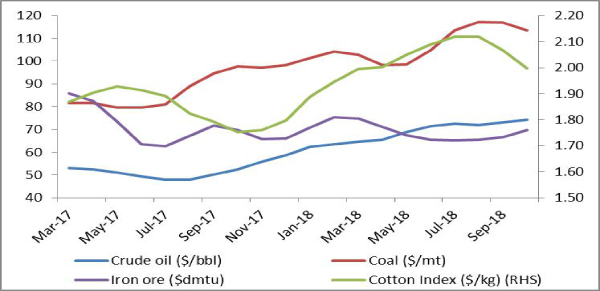
Commodity Price Movement (3 Month Moving Average):
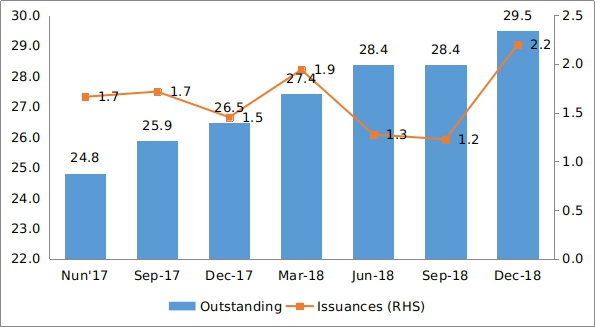
Corporate debt (in Rs. Lakh Cr):
USD-INR Movement:
 Source: RBI, Acuité Research
 +91 99698 98000
 info@acuite.in
 Follow us
 +91 22 49294000
 DOWNLOAD