Acuité considers the following metrics for an appropriate assessment of an entity's financial health and performance:
While certain business segments may require additional financial metrics to be examined, Acuité believes that credit risk assessment based on the above ratios reflect the credit quality of the issuers.
Acuité's approach to rating comprises an evaluation of the quantitative and qualitative aspects of an entity. Acuité takes into account the qualitative aspects through business and management risk analysis whereas financial risk analysis is quantitative in its approach. The table below explains the rating framework and its components:
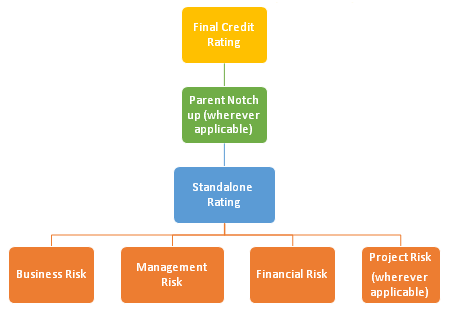
As indicated in the diagram above, financial risk analysis is an essential part of the Rating Framework. It entails examining the various financial metrics and their movement over a period of time. Given below are the key metrics, method of calculation and explanation on their importance from the analytical standpoint:
Net worth refers to the owner's stake in the business. In case of a company, tangible net worth means the aggregate of paid up Share capital and reserves and surplus, after excluding items such as revaluation reserves, intangibles, unamortized miscellaneous expenditure and accumulated losses. Acuité believes that a higher net worth base provides cushion against losses and contingencies. Net worth is indicative of the shock absorption capacity of an entity and its resilience to external conditions.
Acuité observes that, other things remaining equal, higher the net worth base higher is the protection to lenders. Hence, size of the net worth assumes importance while assessing the financial risk profile of an entity.
The capital risk in an organisation is largely dependent on its capital structure and related decisions. Such decisions are often based on several factors including the cost of capital and at times the lenders' policies and the investor's preferences.
The above two parameters adequately describe the capital structure and the associated impact on the entity's credit risk profile.
Debt / Equity Ratio:
Debt / EquityRatio = (Total Debt Long Term and Short Term)/Total Tangible Net worth |
Acuité considers all on-balance sheet debt to arrive at the gearing. For purposes of gearing ratio, apart from regular debt like bank borrowings and non-convertible debentures, Acuité may also include other debt instruments. These include preference shares/debentures/bonds convertible into equity at the option of the holder and other such hybrid instruments. In certain cases, Acuité may also take into account off-balance sheet commitments such as guarantees extended to subsidiaries/group companies etc. while arriving at the gearing depending on the estimates of possible devolvement.
Tangible net worth includes equity share capital and reserves and surplus after excluding items of un-amortized miscellaneous expenditure and accumulated losses, revaluation reserves, other intangibles appearing on the balance sheet. Items such as compulsorily convertible preference shares may be treated as quasi-equity after examining relevant clauses. Unsecured loans from promoters may also be treated as quasi equity if Acuité is satisfied that these will be retained in business till the currency of the credit facilities. Acuité will consider factors such as subordination clause in the bank's sanction letter, the past trends in respect of such loans and the promoter's stated stance while treating it as debt or quasi equity. Acuité may also exclude items such as unrelated investments in/advances to outside entities, receivables that are long overdue from the tangible net worth.
A high debt-equity ratio (DER) is typically associated with higher credit risk. Acuité observes that high gearing magnifies the risk of default especially during a downturn in the economic cycle. Acuité notes that entities with steady revenue streams/stable operating cash flows can sustain higher debt levels than those exhibiting significant volatility in their cash flows across a cycle.
While comparison of gearing across peer entities could lead to insights on their relative credit risk, in case of certain categories of entities such as traders, a different approach is warranted.
Traders and EPC contractors rely more on non-fund based facilities such as letters of credit to fund their working capital requirements. In such cases, Debt / Equity ratio may not correctly reflect the indebtedness of the entity. Hence, Acuité generally examines the TOL/TNW (Total Outside Liabilities/Tangible Networth) to gauge the correct level of indebtedness from a credit rating standpoint.
Total Outside Liabilities to Total Networth:
Total Outside Liabilities to Total Networth = (Total Debt + Other outside liabilities)/Total Tangible Networth |
This ratio expresses how well the owners'/promoters/shareholders' funds cover outside liabilities for the entity. Generally speaking, higher the TOL/TNW, more is the credit risk inherent in the entity. Nevertheless, even in such cases, Acuité examines the nature of business, sectoral trends and other related aspects while arriving at an opinion on the sustainable level of indebtedness.
The operating profit margin represents the core earning capability and is unaffected by leverage or depreciation charges.
Operating Profit Margin:
Operating Profit Margin = (Earnings Before Interest, Tax, Depreciation and Amortisation) / Operating Income |
Operating Income comprises items such as Net Sales ( Gross sales net of sales tax, excise duty and other local taxes) from core operations and other related income of a recurrent nature such as scrap sales, job work income , commission income and export incentives. A consistently high operating margin (vis-a-vis peers/industry standards) implies higher pricing power with clients and efficient cost structure.
From a rating perspective, entities with relatively stable operating margins across a cycle would be preferred to those exhibiting high volatility. Companies with strong brands or operating in niche segments will generally command better operating margins than those in commoditised segments. Similar is the case with companies operating in higher value-added services segments such as high-end IT services vis-a-vis players at the lower end of the value chain.
The operating margin is essentially a measure of the ability of the entity to manage the competitive pressures, cost structure and maintain / improve profitability.
Net Profit Margin:
Net Profit Margin = Net Profit after Taxes/ Operating Income |
Net profit margin is calculated by dividing Net profit after taxes by Operating revenue of the company. It reflects the earnings after considering all operating costs, interest expenses, and depreciation, other items of income and expenditure and taxes. Generally speaking, net profit margins tend to be more volatile across time periods as compared to operating margins.
Apart from the operating cost structure, the net profit margin is also influenced by leverage levels, asset intensity, tax outgo and abnormal items of income/expenditure. Against this backdrop, the comparison of net profit margins across time periods/entities may be of limited utility to the analyst till he has an insight into the reasons for variations across time periods. For instance, an abnormally higher ‘other income' of a non-recurring nature such as profit on sale of non-core assets will artificially boost net profit margins of an entity for a certain period vis-a-vis that of other years. Hence, comparability of net margins across periods from a future projection standpoint may be misleading unless the abnormal influences are evened out. Similarly, the net profit margin of an entity operating in a tax-free geography may not be comparable with an entity paying taxes at the highest marginal rates. Despite its limitations, the Net profit margin reflects a broad metric of the ability of an entity to generate internal accruals and to increase its net worth from internal generation. Other factors remaining constant, higher the net profit margin, better is the ability of the entity to support a high growth trajectory.
Debt protection metrics help analyse the nature of interaction of various income statement items with the balance sheet structure of the entity. The analysis of these metrics evolves at three levels – Acuité first analyses debt protection by taking into account the coverage of interest payments, followed by the principal payment and eventually the entire quantum of debt on books.
Given the above approach, Acuité first analyses the Interest Coverage Ratio of the entity.
Interest Coverage Ratio:
Interest Coverage Ratio = EBITDA/Interest Charges |
This ratio describes how well the operating profit covers interest payments made by the entity in a financial year. In addition to the interest charges, Acuité also considers preference dividend and other bank charges while calculating this ratio. A higher ratio implies better debt protection. However, this ratio does not provide a holistic picture with respect to the degree of debt protection as it considers only interest coverage. For term loans, Acuité relies on the Debt Service Coverage Ratio (DSCR) for the above.
Debt Service Coverage Ratio:
Debt Service Coverage Ratio = (Net Profit + Depreciation + Interest Charges) / (Interest Charges + Current Maturity of Long Term Debt) |
DSCR evaluates how well the cash accruals in the given year cover the quantum of debt servicing required. While Acuité believes a higher ratio indicates that an entity should be able to service its debt from current year cash accruals, DSCR below 1 time indicates that the issuer may face debt servicing pressures and hence has a higher risk of default. Higher the DSCR, better will be the ability to service debt in a timely manner. Acuité also believes that DSCR must be sufficiently above 1 time in order to reduce the susceptibility of the entity's debt servicing ability in light of the adverse industry or environmental factors.
Net Cash Accruals to Total Debt:
NCATD = (PAT+ Depreciation- Dividend) / (Total Debt Long term & Short term) |
Net Cash Accruals to Total Debt is a debt protection metric which links the total debt of the entity to its net cash accruals for any given period.
It is a rough surrogate for coverage of the debt with net cash accruals from a business. A NCATD of 25% would broadly indicate that the entity would need around four years of net cash accruals to liquidate its current levels of debt. This ratio does not make a distinction between different types of debt- short term or long term. Hence, its utility to gauge the debt servicing ability over a period is limited vis-a-vis the interest coverage ratio or DSCR discussed above. Nevertheless, despite its limitations, Acuité observes that generally speaking, entities with consistently higher NCATD levels have resilient credit profiles than those with lower NCATD.
Debt to EBITDA:
Debt to EBITDA = Total Debt /EBITDA |
Apart from DSCR, Acuité believes that the Debt to EBITDA Ratio is also an important metric to assess default risk which comes along with the maturity profile of the existing debt.
This ratio is an indicator of the amount of time that the entity will need to repay the current amount of debt on its books by utilising operating profits. In case Debt to EBITDA is higher than the overall maturity of the debt, the entity will be required to refinance its debt or ensure timely infusion of capital by promoters. Irrespective of the recourse chosen, the high Debt to EBITDA is representative of a significantly greater degree of credit risk.
Return on Capital Employed:
Return on Capital Employed= EBITDA / Total Capital Employed where, total capital employed is defined as: |
Acuité measures the efficiency with which capital employed in the business is utilised. It is typically measured by analysing the Return on Capital Employed of the entity. A key advantage of ROCE is that it is unaffected by leverage and is a metric which lends itself to comparability across sectors.
Acuité observes that ROCE ratios tend to be depressed particularly when the entity is on a growth trajectory or in case of commodity-based industries during the trough of a commodity cycle. Since there is often a time lag between capital expenditure and benefits accruing therefrom, the ROCE ratios will be low during the period of heavy capex. Acuité considers the trend of ROCE across a cycle to understand the overall efficiency of the unit rather than that for a specific period.
Liquidity refers to an entity‘s ability to meet its obligations (financial and commercial) in a timely manner. A strong liquidity profile implies ready availability of unencumbered cash and liquid assets to meet debt servicing commitments and day-to-day business related expenses as and when they fall due.
In Liquidity assessment, Acuité evaluates availability of unencumbered cash/liquid assets with the entity, unutilised bank lines and potential for timely liquidity support from group entities with stronger credit profiles. Acuité may also examine the refinancing ability of the entity while assessing liquidity profile especially in cases where the entity has significant debt repayment obligations.
Evaluation of the Current Ratio is an important tool to determine the liquidity position of an entity.
It is a metric of how the current assets of an entity are funded.
Current Ratio:
Current Ratio= (Current Assets) / (Current Liabilities) |
A current ratio indicates how current assets of an entity have been financed. A ratio above 1 indicates that a portion of the current assets have been funded by long term sources. A ratio below 1 indicates that a portion of the short term funds have been used to support long term assets. Generally, current ratios below 1 are viewed as a sign of possible stress. In this context, Acuité believes that rather than relying on current ratios in isolation, it is necessary to examine the ratio in conjunction with other metrics such as working capital cycle and the nature of activity.
Lenders have been traditionally examining trends in current ratio for assessing proposals for working capital financing. From a lender's perspective, higher the current ratio (i.e. higher the proportion of long term funds supporting current assets), higher is the protection available to the banker. Acuité believes that in addition to the Current Ratio and its trends, it is also necessary to factor in the quality of current assets. For instance, other aspects remaining the same, a unit dealing in a commodity business is likely to have a better liquidity profile than a unit dealing in customised products because of the former's ability to liquidate its inventory at a short notice.
A mere examination of the current ratio will not reveal these critical aspects. In most of the cases, along with the movement in current ratio, it is necessary to examine movements in working capital cycle. The working capital cycle in days is calculated as under.
Working Capital Days:
Working Capital Days = Debtor Days + Inventory Days - Creditor Days |
Working capital days indicate the number of days it takes for an entity to realise cash from its production/trading cycle. Higher working capital days indicate that the company takes more days to realise its cash from operations. Also, it would mean higher external funding requirement for the entity. Here again, Acuité examines each item of working capital to understand the impact on the liquidity profile of the unit.
Cash Flow Analysis
Acuité‘s analysis focusses on profitability as well as cash flow. The ability of an entity to meet commitments to its lenders and other stakeholders depends on its internal cash generation ability. An entity with a robust operational cash flow will depend less on external funding to fund its growth.
Auditor Comments and Remarks
 +91 99698 98000
 info@acuite.in
 Follow us
 +91 22 49294000
 DOWNLOAD