Since Capital Goods and Consumer Durables categories are moving in opposite direction at the moment due to inventory build-up, we reserve our judgement until Q3 numbers are revealed
Even though in terms of value addition (GVA), the manufacturing sector has been growing at over 9% YoY, volumes have remained stagnant. Primarily, the sector contributes almost 38% to the Core sectors by weight and has been a focus area under the ‘Make in India’ plan. However, the global slowdown and Chinese glut have created immense pressure for the sector. As a result, Indian firms have been stuck with underutilised capacities and thereby lack of interest for capex. Therefore, from the volumes perspective, the sector has been stable at near zero percent growth levels as top-lines remain stagnant. However, one must also note that low commodity prices have also helped margins and Acuité believes that the situation has to an extent eased margins for the manufacturing sector. The Manufacturing PMI has been growing consistently for the last nine consecutive months and the sector thus deserves a review by end of Q3.
Since Capital Goods and Consumer Durables categories are moving in opposite direction at the moment due to inventory build-up, we reserve our judgement until Q3 numbers are revealed
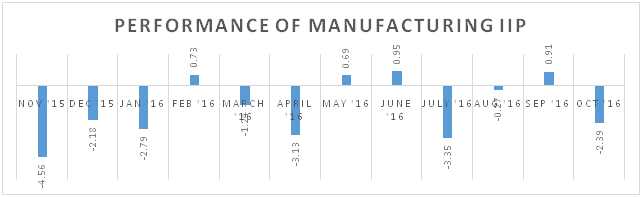
When considering the IIP numbers, the focus shifts to numbers of units produced rather than value added. In totality, the sector maintains a weight of 75% in the overall IIP and growth was recorded at (-) 2.4% as on October 2016. Despite of the fact that 61% of the sector grew on an average of 6%, heavyweight sectors such as Textiles, Electrical Machinery and Furniture declined substantially. With considerable influence over the general industrial health of the economy, manufacturing sector’s outlook can be measured through both consumer as well as capital goods. Since these categories are moving in opposite direction at the moment due to inventory build-up, we reserve our judgement until Q3 numbers are revealed.
Seasonally adjusted Capacity utilization levels (CU) have been anyway fallen below the 71% mark after recovering in Q1 FY15-16. Growth in Credit Offtake to the sector is at an all-time low of (-) 1.7% and has averaged 1.5% in the entire year, while overall offtake is nearly 8%. Lack of capacity augmentation and underutilization of capacity are sighted as the principal reasons for the negative sentiment in the sector. Cheap Chinese substitutes are yet another obstacle for growth. We believe that in the medium term, a strong and sustained consumer demand will however infuse confidence in the sector as inventories give way to fresh orders.
Principal factors influencing the category
| Industry/Retail Credit Offtake |
| Systemic Inventories |
| Capacity Utilization Levels (CU) |
| Repo rate/ Interest Cost |
| Economic Growth & Outlook |
| Government Policy & Support |
(Updated as on March 15, 2017)
 +91 99698 98000
 info@acuite.in
 Follow us
 +91 22 49294000
 DOWNLOAD